Data Protection Advisor is an excellent tool for producing information about your backup environment, but not everyone has it in their environment. So if you’re needing to go back to basics to monitor device performance unattended without DPA in your environment, you need to look at nsradmin.
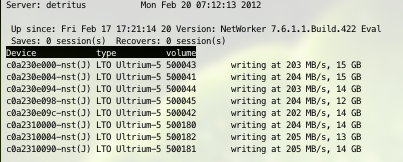
Of course, if you’ve got realtime access to the NetWorker environment you can simply run nsrwatch or NMC. In either of those systems, you’ll see device performance information such as, say:
writing at 154 MB/s, 819 MB
It’s that same information that you can get by running nsradmin. At its most basic, the command will look like the following:
nsradmin> show name:; message:
nsradmin> print type: NSR device
Now, nsradmin itself isn’t intended to be a full scripting language aka bash, Perl, PowerShell or even (heaven forbid) the DOS batch processing system. So if you’re going to gather monitoring details about device performance from your NetWorker server, you’ll need to wrap your own local operating system scripting skills around the process.
You start with your nsradmin script. For easy recognition, I always name them with a .nsri extension. I saved mine at /tmp/monitor.nsri, and it looked like the following:
show name:; message:
print type: NSR device
I then created a basic bash script. Now, the thing to be aware of here is that you shouldn’t run this sort of script too regularly. While NetWorker can sustain a lot of interactions with administrators while it’s running without an issue, why add to it by polling too frequently? My general feeling is that polling every 5 minutes is more than enough to get a view of how devices are performing overnight.
If I wanted to monitor for 12 hours with a five minute pause between checks, that would be 12 checks an hour – 144 checks overall. To accomplish this, I’d use a bash script like the following:
#!/bin/bash
for i in `/usr/bin/seq 1 144`
do
        /bin/date
        /usr/sbin/nsradmin -i /tmp/monitor.nsri
        /bin/echo
        /bin/sleep 300
done >> /tmp/monitor.log
You’ll note from the commands above that I’m writing to a file called /tmp/monitor.log, using >> to append to the file each time.
When executed, this will produce output like the following:
Sun Aug 02 10:40:32 AEST 2015
                        name: Backup;
                     message: "reading, data ";

                        name: Clone;
                     message: "writing at 94 MB/s, 812 MB";


Sun Aug 02 10:45:32 AEST 2015
                        name: Backup;
                     message: "reading, data ";

                        name: Clone;
                     message: "writing at 22 MB/s, 411 MB";


Sun Aug 02 10:50:32 AEST 2015
                        name: Backup;
                     message: "reading, data ";

                        name: Clone;
                     message: "writing at 38 MB/s, 81 MB";


Sun Aug 02 10:55:02 AEST 2015
                        name: Clone;
                     message: "writing at 8396 KB/s, 758 MB";

                        name: Backup;
                     message: "reading, data ";
There you have it. In actual fact, this was the easy bit. The next challenge you’ll have will be to extract the data from the log file. That’s scriptable too, but I’ll leave that to you.
