Data Domain Management Centre (DDMC) is a free virtual appliance available for customers with Data Domain to provide a web interface for monitoring and managing multiple Data Domains from the same location. Even if you’ve only got one Data Domain in your environment, it can provide additional functionality for you.
The system resource requirements for DDMC are trivially small, viz.:
| Size | # DDs | vCPU | vRAM | HDD Space (Install+Data) |
|---|---|---|---|---|
| Small | 1-25 | 1 | 2 | 40+50 |
| Medium | 1-50 | 2 | 3 | 40+100 |
| Large | 1-75 | 2 | 4 | 40+200 |
If you’ve used the standard per-system Data Domain web interface, it’s very likely you’ll be at home instantly with DDMC.
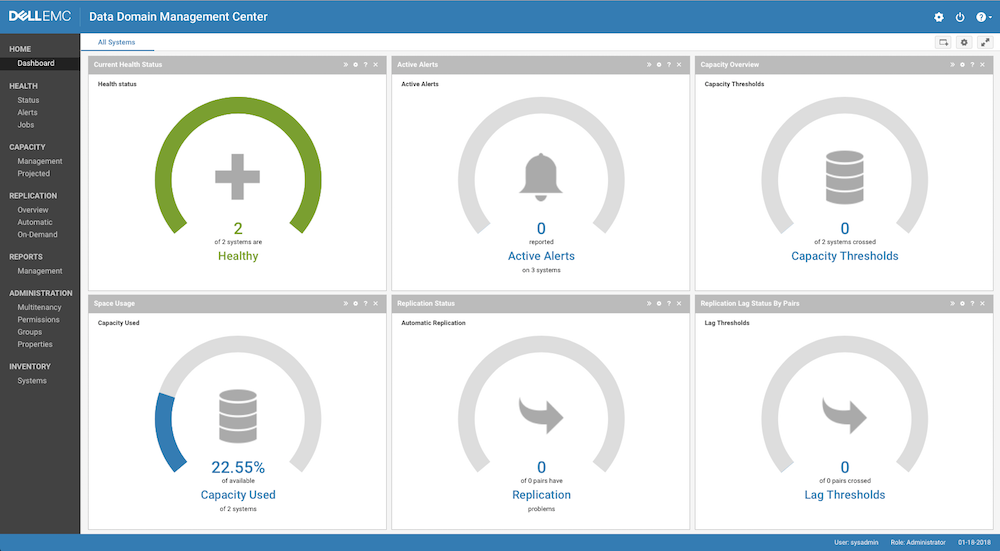
After you’ve logged in, you’ll get a “quick view” dashboard of the system, featuring everyone’s favourite graphs – the donut.
In my case, I’ve got DDMC running to monitor two DDVEs I have in my lab – so there’s not a lot to see here. If there are any alerts on any of the monitored systems (and the DDMC includes itself in monitored systems, which is why you’ll get 1 more system than the number of DDs your monitoring in the ‘Alerts’ area), that’ll be red, drawing your attention straight away to details that may need your attention. Each of those widgets is pretty straight forward – health, capacity thresholds, replication, capacity used, etc. Nothing particularly out of the ordinary there.
DDMC is designed from the ground up to very quickly let you see the status of your entire Data Domain fleet. For instance, looking under Health > Status, you see a very straight-forward set of ‘traffic light’ views:
This gives you a list of systems, their current status, and a view as to what protocols and key features are enabled. You’ll note three options above “HA Readiness”. These are, in left-to-right order:
- All systems
- Groups – Administrator configurable collections of Data Domains (e.g., by physical datacentre location such as “Moe”, “Subiaco”, “Tichborne”, or datacentre location, such as “Core”, “ROBO”, “DMZ”, etc.)
- Tenants – DDMC is tenant aware, and lets you view information presented by tenancy as well.
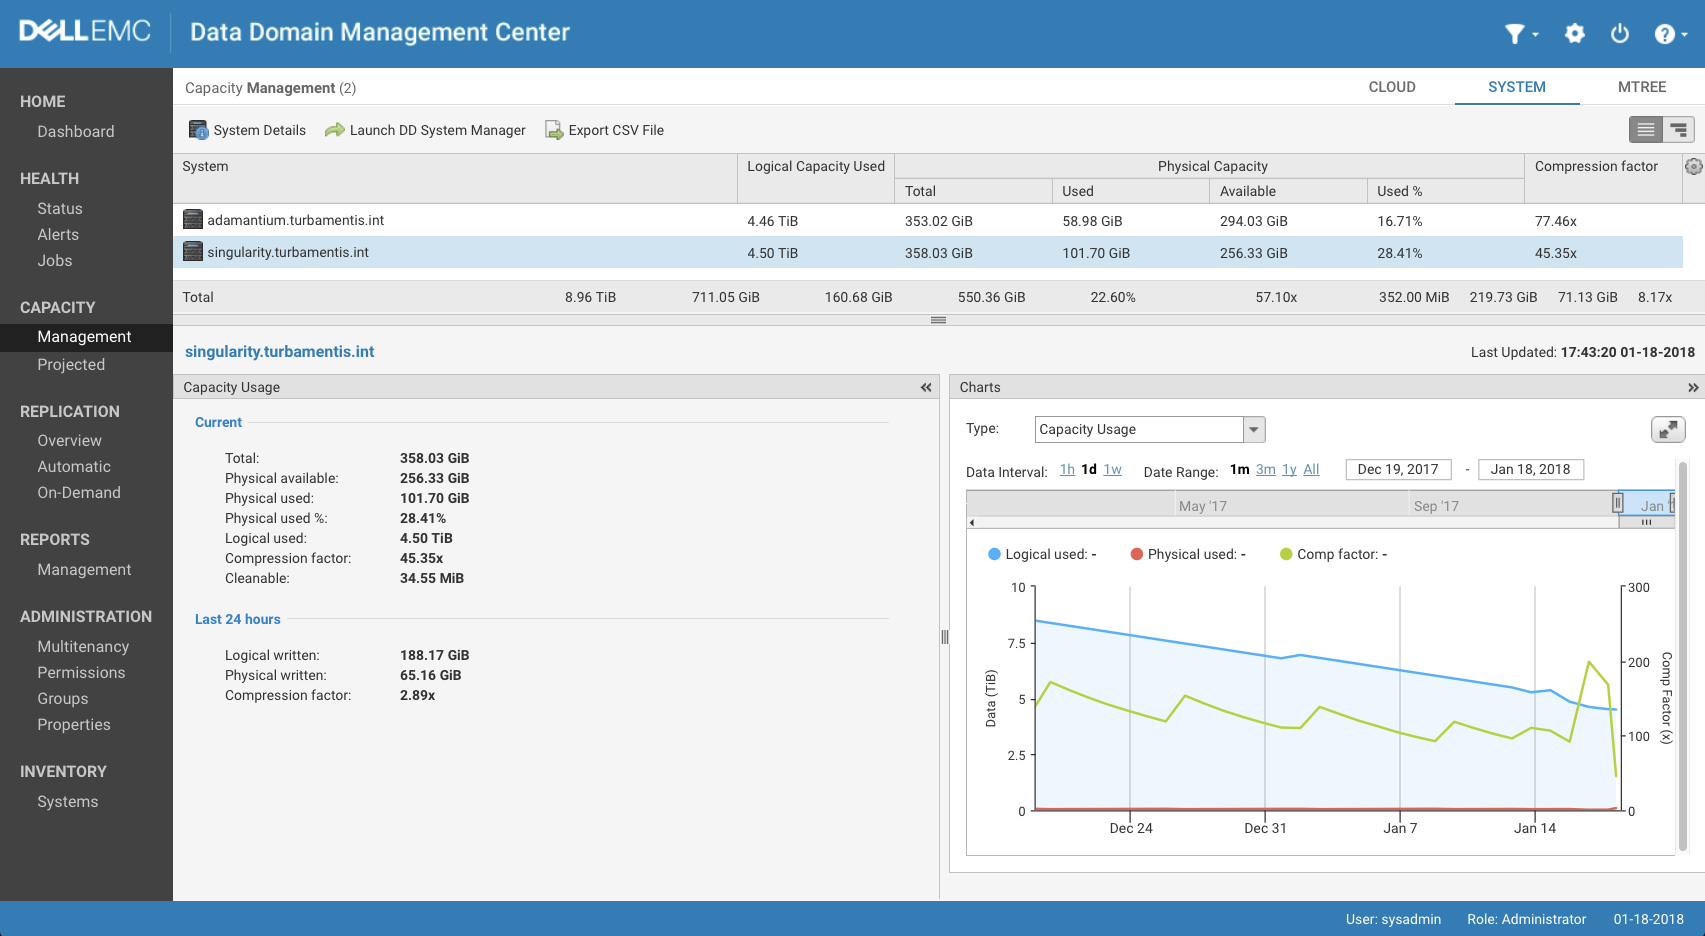
There’s a variety of options available to you in DDMC for centralised management – for instance, being able to roll out OS updates to multiple Data Domains from a central location. But there’s also some great centralised reporting and monitoring for you as well. For instance, under Capacity Management, you can quickly get views such as:
From this pane you can very quickly see capacity utilisation on each Data Domain, with combined stats across the fleet. You can also change what sort of period of time you’re viewing the information for – the default graph in the above screen shot for instance shows weekly capacity utilisation over the most recent one month period on one of my DDVEs.
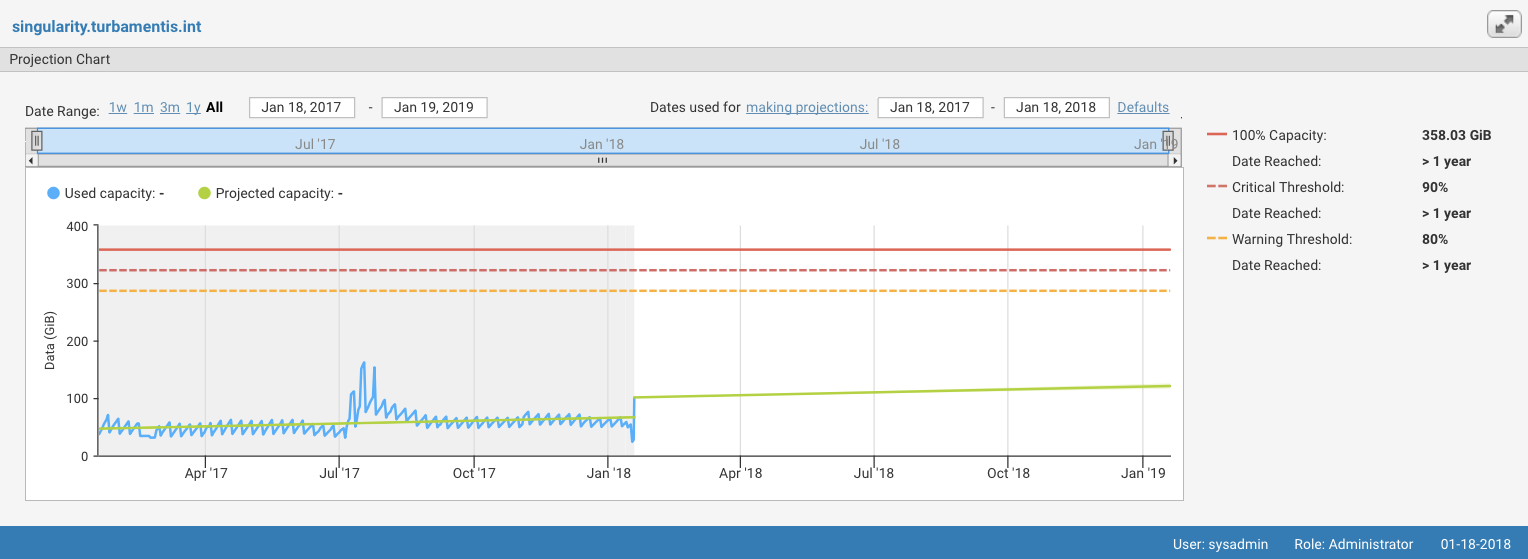
What’s great though is that underneath “Management”, you’ll also see an option for Projected. This is where DDMC gives you a great view for your systems – what does it project, based on either a default range, or your own selected range of dates, the capacity utilisation of the system will be?
In my case, above, DDMC is presenting a sudden jump in projected capacity on the day fo the report being run (January 18, 2018) simply because that was the day I basically doubled the amount of data being sent to the Data Domain after a fairly lengthy trend of reasonably consistent weekly backup cycles. You’ll note though that it projects out three key dates:
- 100% (Full)
- 90% (Critical)
- 80% (Warning)
Now, Data Domain will keep working fine up to the moment you hit 100% full, at which point it obviously can’t accept any more data. The critical and warning levels are pretty standard recommended capacity monitoring levels, particularly for deduplication storage. 80% is a good threshold for determining whether you need to order more capacity or not, and have it arrive in time. 90% is your warning level for environments where you prefer to run closer to the line – or an alert that you may want to manually check out why the capacity is that high. So there’s nothing unusual with having 80 and 90% alert levels – they’re actually incredibly handy.
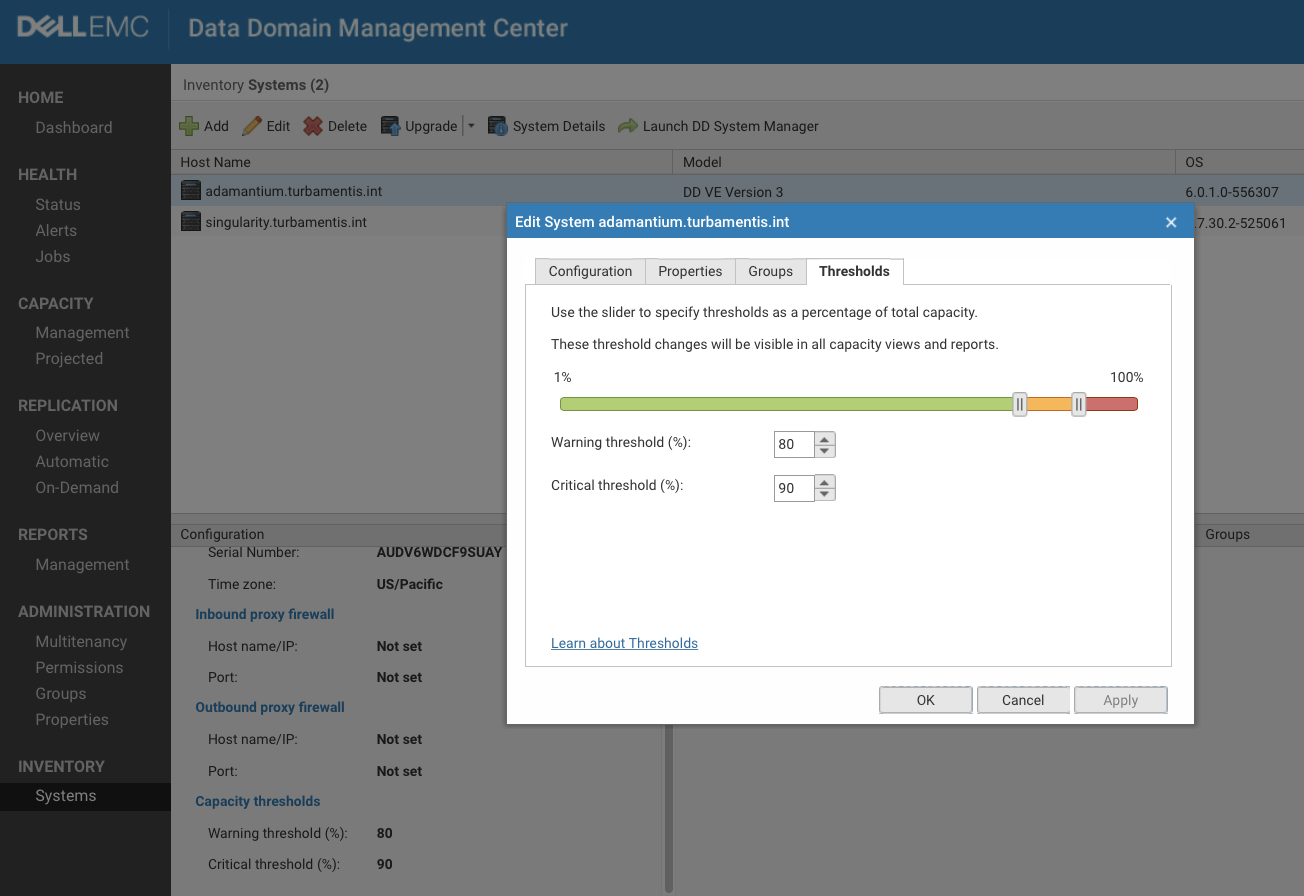
I’m not going to go through each option within DDMC, but I will pause the review with Systems Inventory:
Within the Inventory area in DDMC, you can view quick details of OS/etc details for each Data Domain, perform an upgrade, and edit various aspects of the system information. In particular, the area I’m showing above is the Thresholds area. DDMC doesn’t hard-set the threshold alerts to 80% and 90%; instead, if you have particular Data Domains that need different threshold notification areas, you can make those changes here, ensuring that your threshold alerts and projections are accurate to your requirements.
DDMC isn’t meant to be a complex tool; the average Data Domain/backup administrator will likely find it simple and intuitive to use with very little time taken just wandering around in the interface. If you’ve got an operations team, it’s the sort of thing you’ll want the operators to have access to in order to keep an eye on your fleet; if you’re an IT or capacity manager you might use it as a starting point to keeping any eye on capacity utilisation, and if you’re a backup or storage administrator in an environment with multiple Data Domains, you’ll quickly get used to referring to the dashboard and management options to make your life simpler.
Also, at $0 and with such simple infrastructure requirements to run it, it’s not really something you have to think about.


Hi,
Also I use DDMC since more than one year with > 50 DDs (2500 – 9800).
It’s really very helpful tool for Managing, ressource planing and monitoring.
I can recommendation too.