The world is changing, and data protection is changing with it. (OK, that sounds like an ad for Veridian Dynamics, but I promise I’m serious.)
One of the areas in which data protection is changing is that backup environments are growing in terms of deployments. It’s quite common these days to see multiple backup servers deployed in an environment – whether that’s due to acquisitions, required functionality, network topology or physical locations, the reason doesn’t really matter. What does matter is that as you increase the number of systems providing protection within an environment, you want to be able to still manage and monitor those systems centrally.
Data Protection Central (DPC) was released earlier this month, and it’s designed from the ground up as a modern, HTML5 web-based system to allow you to monitor your Avamar, NetWorker and Data Domain environments, providing health and capacity reporting on systems and backup. (It also builds on the Multi Systems Manager for Avamar to allow you to perform administrative functions within Avamar without leaving the DPC console – and, well, more is to come on that front over time.)
I’ve been excited about DPC for some time. You may remember a recent post of mine talking about Data Domain Management Center (DDMC); DPC isn’t (at the moment at least) a replacement for DDMC, but it’s built in the same spirit of letting administrators have easy visibility over their entire backup and recovery environment.
So, what’s involved?
Well, let’s start with the price. DPC is $0 for NetWorker and Avamar customers. That’s a pretty good price, right? (If you’re looking for the product page on the support website by the way, it’s here.)
You can deploy it in one of two ways; if you’ve got a SLES server deployed within your environment that meets the requirement, you can download a .bin installer to drop DPC onto that system. The other way – and quite a simple way, really, is to download a VMware OVA file to allow you to easily deploy it within your virtual infrastructure. (Remember, one of the ongoing themes of DellEMC Data Protection is to allow easy virtual deployment wherever possible.)
So yesterday I downloaded the OVA file and today I did a deployment. From start to finish, including gathering screenshots of its operation, that deployment, configuration and use took me about an hour or so.
When you deploy the OVA file, you’ll get prompted for configuration details so that there’s no post-deployment configuration you have to muck around with:
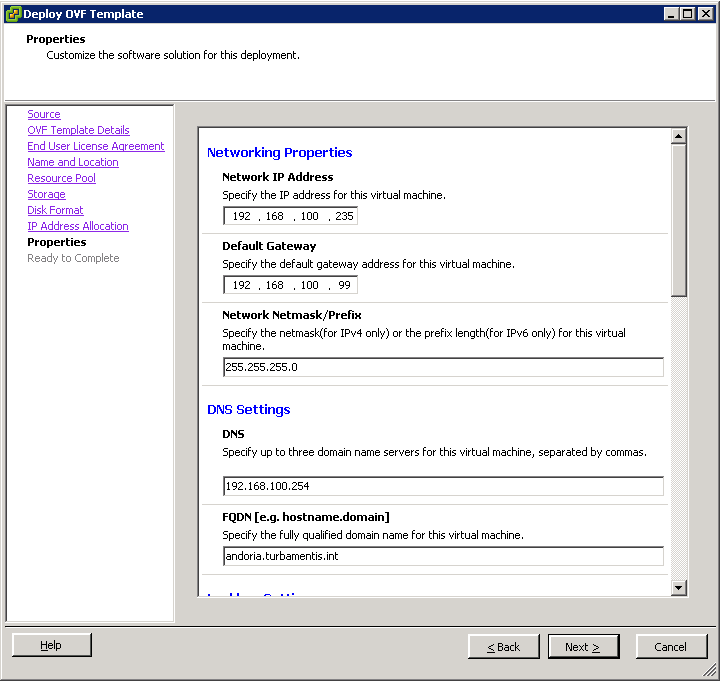
At this point in the deployment, I’ve already selected where the virtual machine will deploy, and what the disk format is. (If you are deploying into a production environment with a number of systems to manage, you’ll likely want to follow the recommendations for thick provisioning. I chose thin, since I was deploying it into my lab.)
You fill in standard networking properties – IP address, gateway, DNS, etc. Additionally, per the screen shot below, you can also immediately attach DPC into your AD/LDAP environment for enterprise authentication:
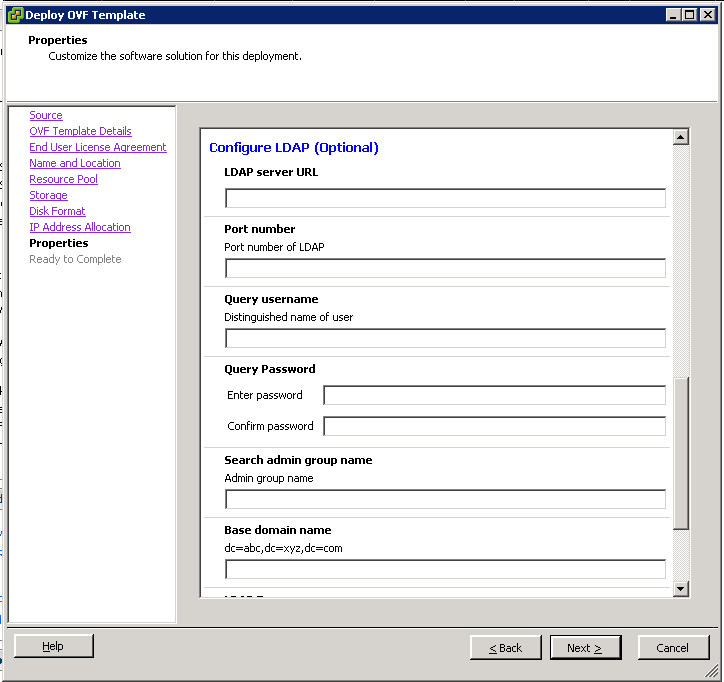
I get into enough trouble at home for IT complexity, so I don’t run LDAP (any more), so there wasn’t anything else for me to do there.
The deployment is quite quick, and after you’re done, you’re ready to power on the virtual machine.
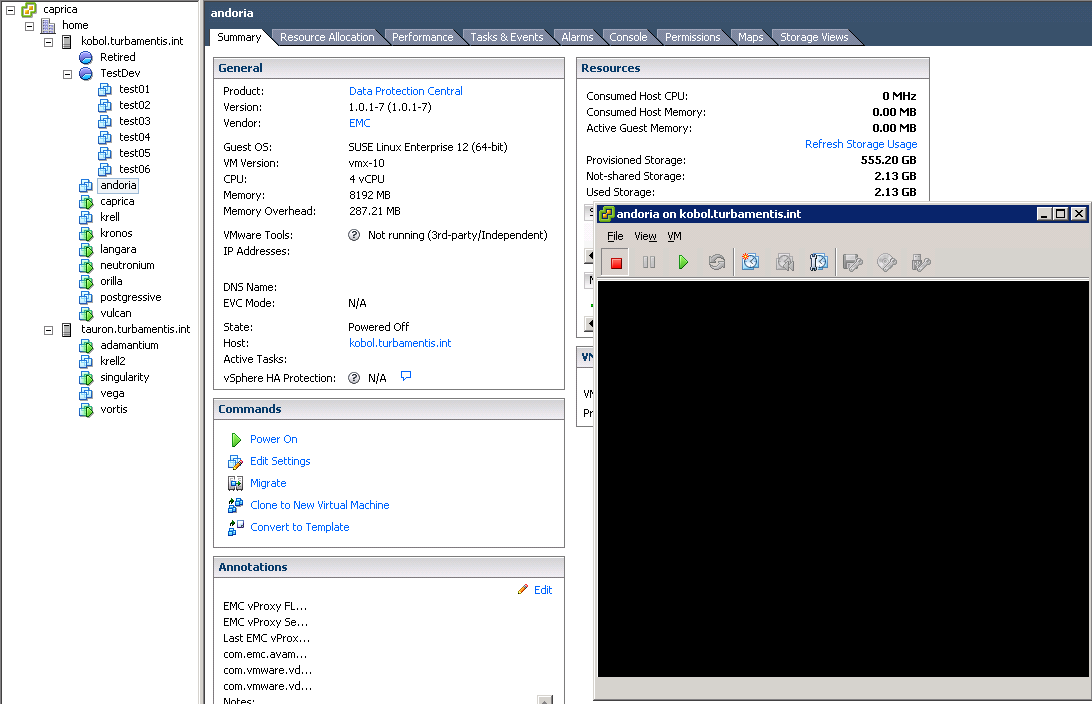
In fact, one of the things you’ll want to be aware of is that the initial power on and configuration is remarkably quick. (After power-on, the system was ready to let me log on within 5 minutes or so.)
It’s a HTML5 interface – that means there’s no Java Web Start or anything like that; you simply point your web browser at the FQDN or IP address of the DPC server in a browser, and you’ll get to log in and access the system. (The documentation also includes details for changing the SSL certificate.)
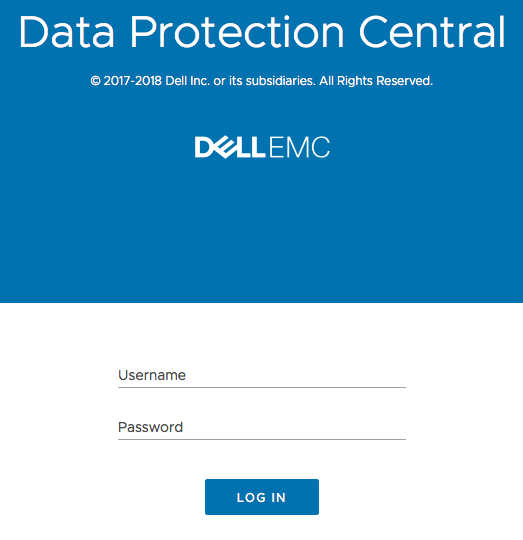
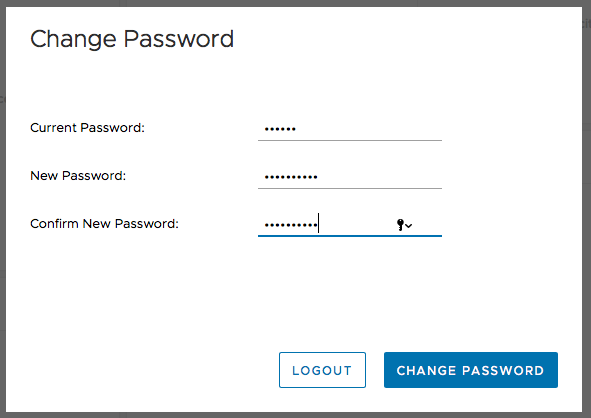
DPC follows Dell’s interface guidelines, so it’s quite a crisp and easy to navigate interface. The documentation includes details of your initial login ID and password, and of course, following best practices for security, you’re prompted to change that default password on first login:
After you’ve logged in, you get to see the initial, default dashboard for DPC:
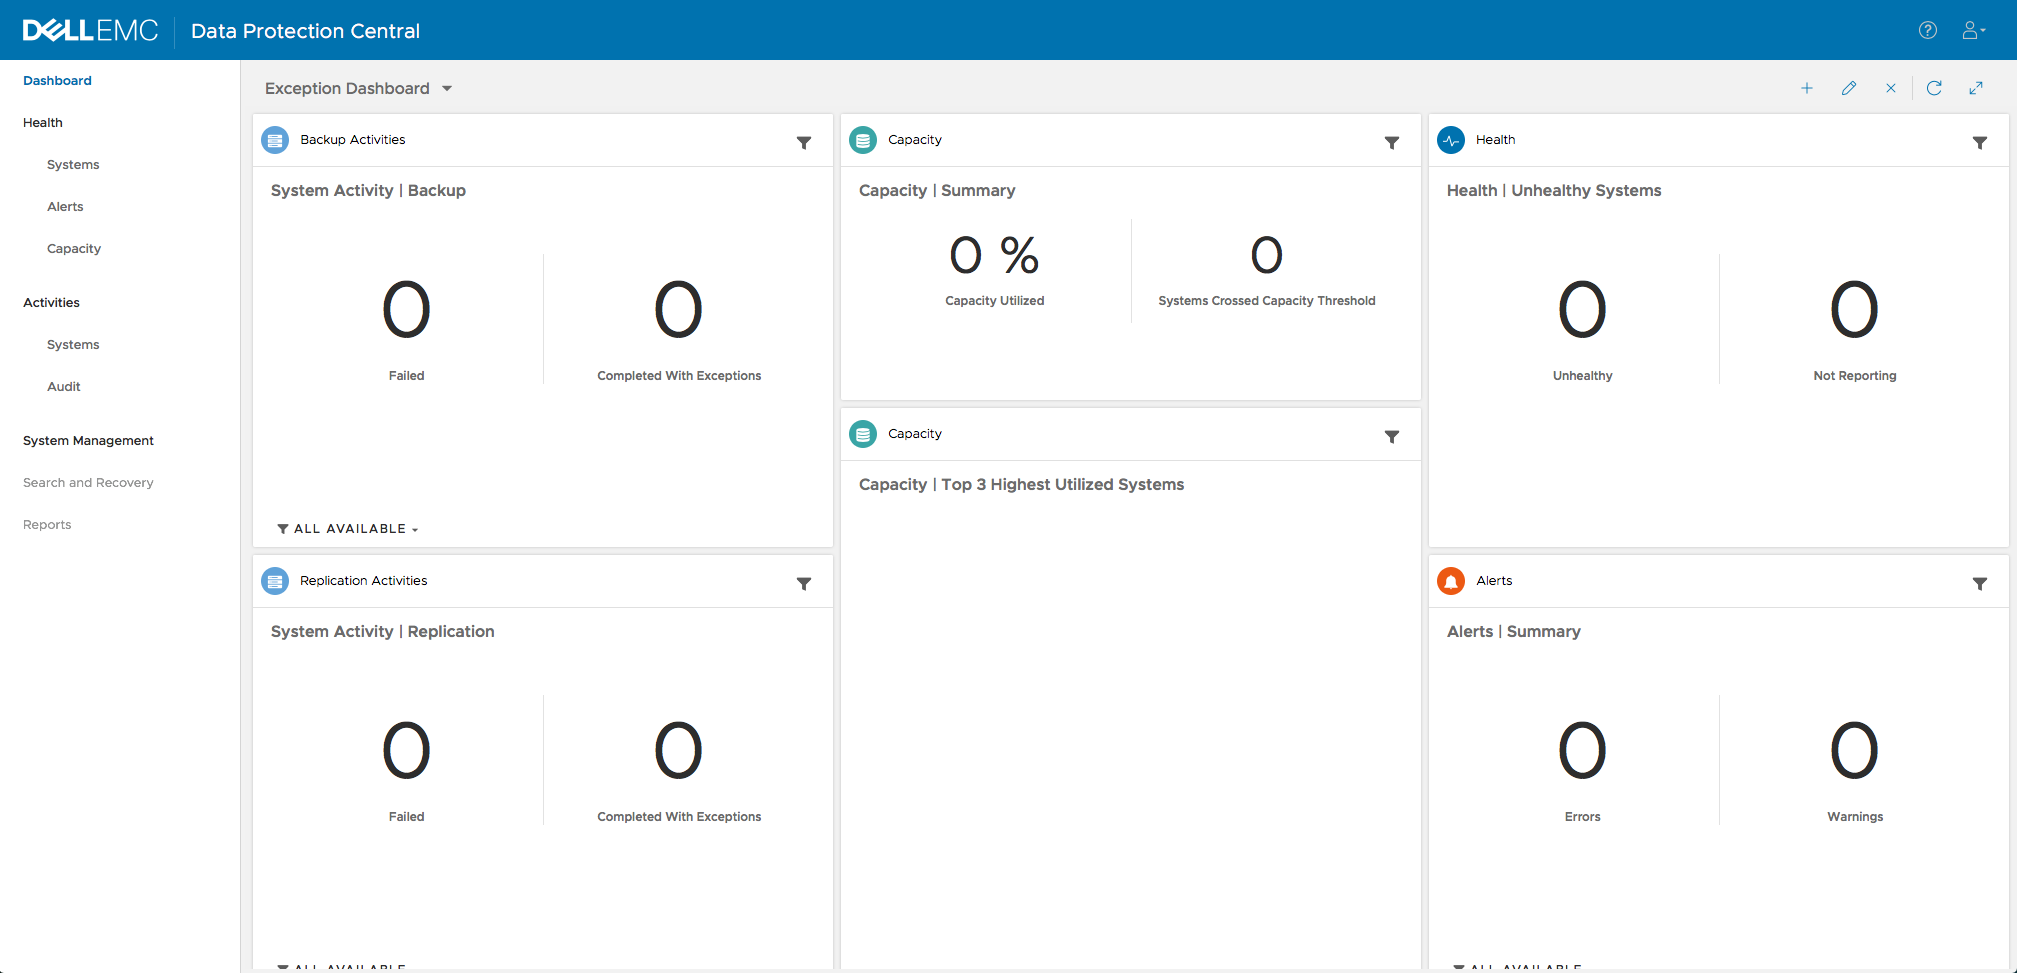
Of course, at this point, it looks a wee bit blank. That makes sense – we haven’t added any systems to the environment yet. But that’s easily fixed, by going to System Management in the left-hand column.
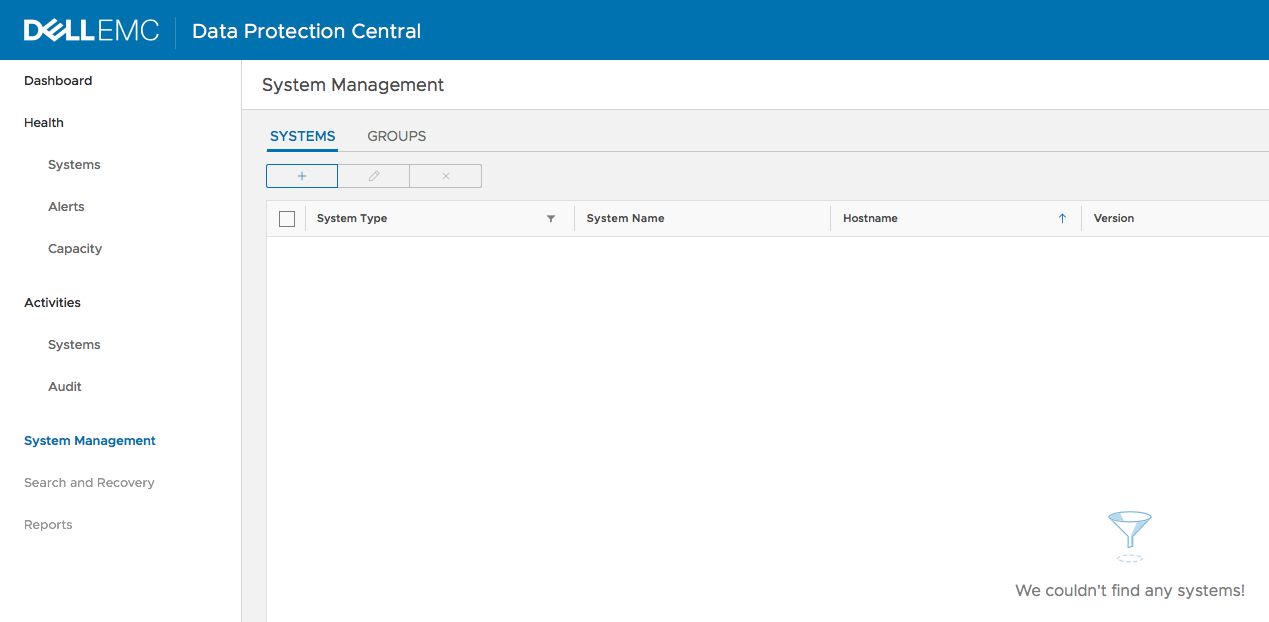
System management is quite straightforward – the icons directly under “Systems” and “Groups” are for add, edit and delete, respectively. (Delete simply removes a system from DPC, it doesn’t un-deploy the system, of course.)
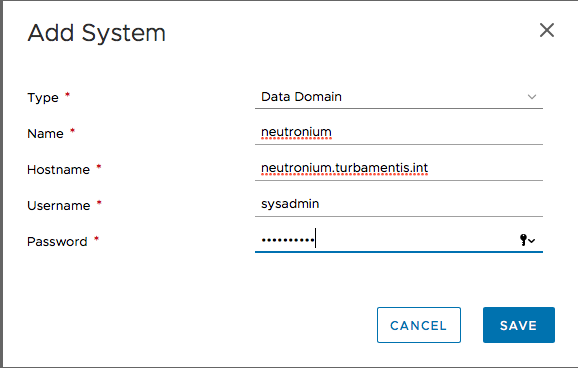
When you click the add button, you are prompted whether you want to add a server into DPC. (Make sure you check out the version requirements from the documentation, available on the support page.) Adding systems is a very straight-forward operation, as well. For instance, for Data Domain:
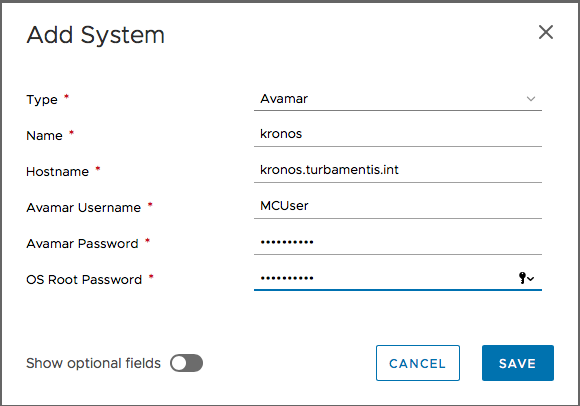
Adding an Avamar server is likewise quite simple:
And finally, adding a NetWorker server:
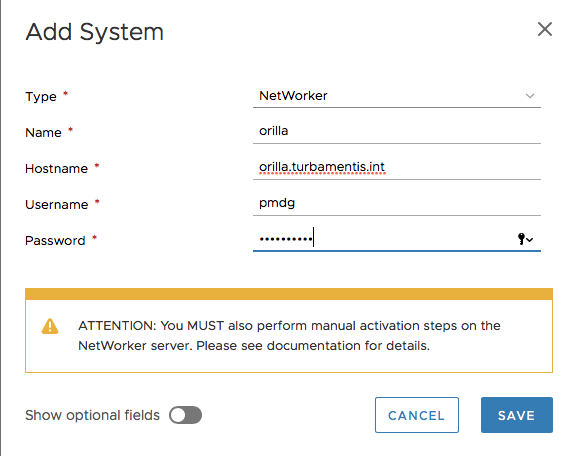
Now, you’ll notice here, DPC prompts you that there’s some added configuration to do on the NetWorker server; it’s about configuring the NetWorker rabbitmq system to be able to communicate with DPC. For now, that’s a manual process. After following the instructions in the documentation, I also added the following to my /etc/rc.d/rc.local file on my Linux-based NetWorker/NMC server to ensure it happened on every reboot, too:
/bin/cat <<EOF | /opt/nsr/nsrmq/bin/nsrmqctl
monitor andoria.turbamentis.int
quit
EOF
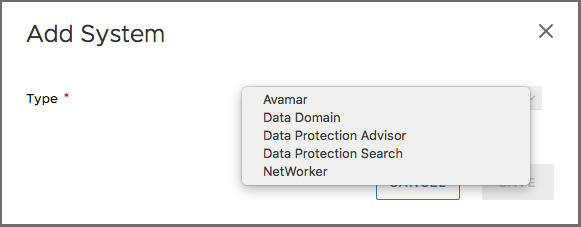
It’s not just NetWorker, Avamar and Data Domain you can add – check out the list here:
Once I added all my systems, I went over to look at the Activities > Audit pane, which showed me:

Look at those times there – it took me all of 8 minutes to change the password on first login, then add 3 Data Domains, an Avamar Server and a NetWorker server to DPC. DPC has been excellently designed to enable rapid deployment and time to readiness. And guess how many times I’d used DPC before? None.
Once systems have been added to DPC and it’s had time to poll the various servers you’re monitoring, you start getting the dashboards populated. For instance, shortly after their addition, my lab DDVE systems were getting capacity reporting:
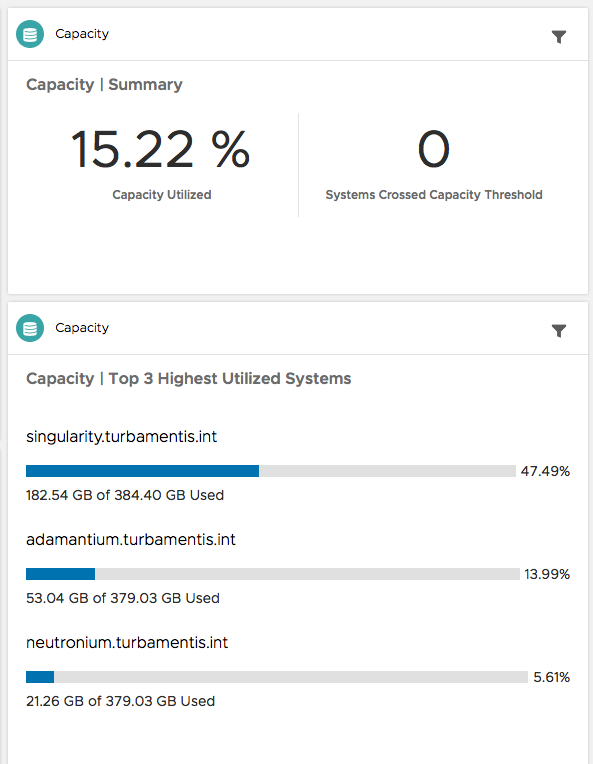
You can drill into capacity reporting by clicking on the capacity report dashboard element to get a tabular view covering Data Domain and Avamar systems:
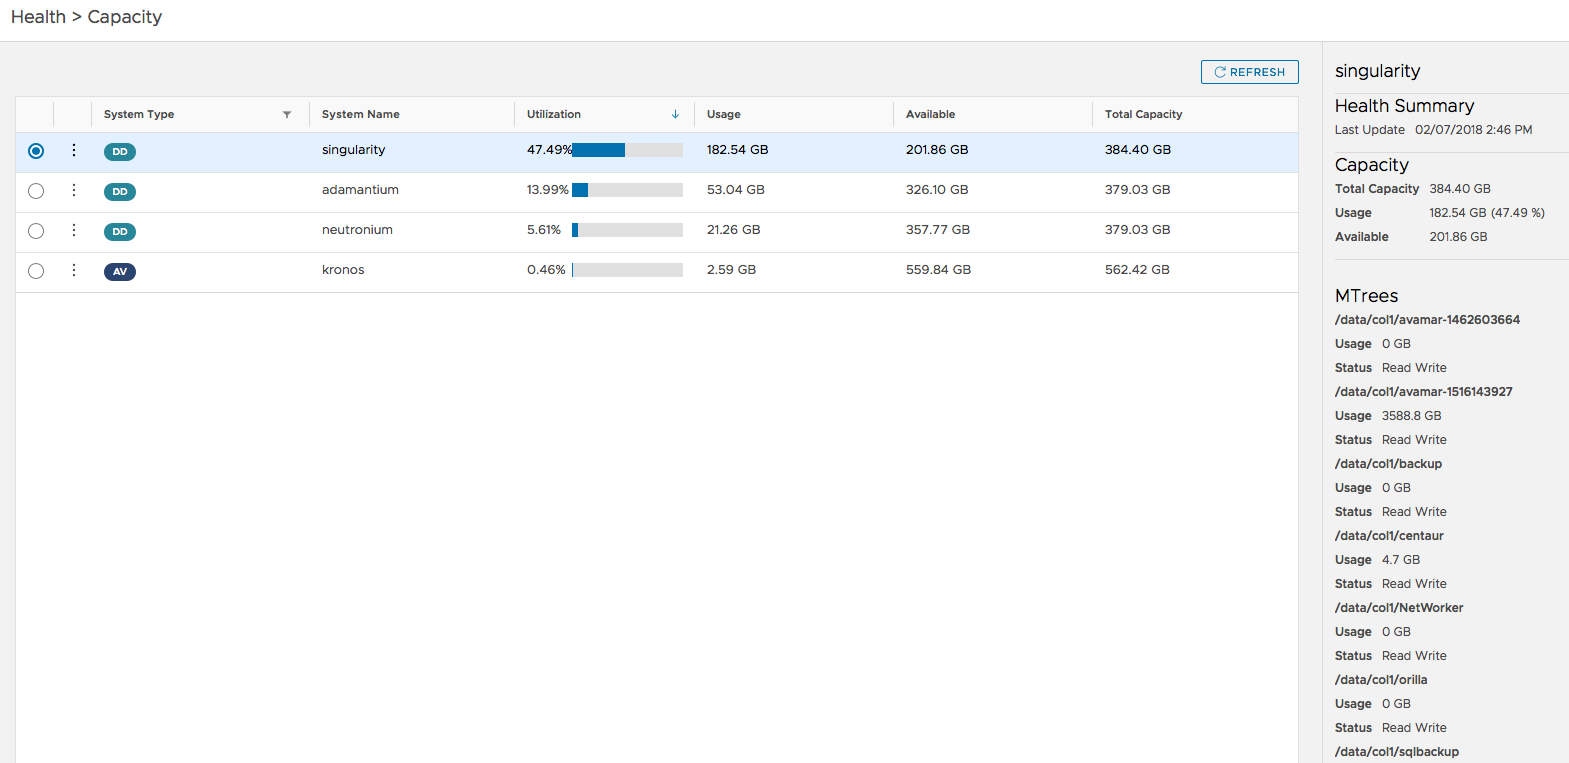
On that detailed capacity view, you see basic capacity details for Data Domains, and as you can see down the right hand side, details of each Mtree on the Data Domain as well. (My Avamar server is reported there as well.)
Under Health, you’ll see a quick view of all the systems you have configured and DPC’s assessment of their current status:

In this case, I had two systems reported as unhealthy – one of my DDVEs had an email configuration problem I lazily had not gotten around to fixing, and likewise, my NetWorker server had a licensing error I hadn’t bothered to investigate and fix. Shamed by DPC, I jumped onto both and fixed them, pronto! That meant when I went back to the dashboards, I got an all clear for system health:
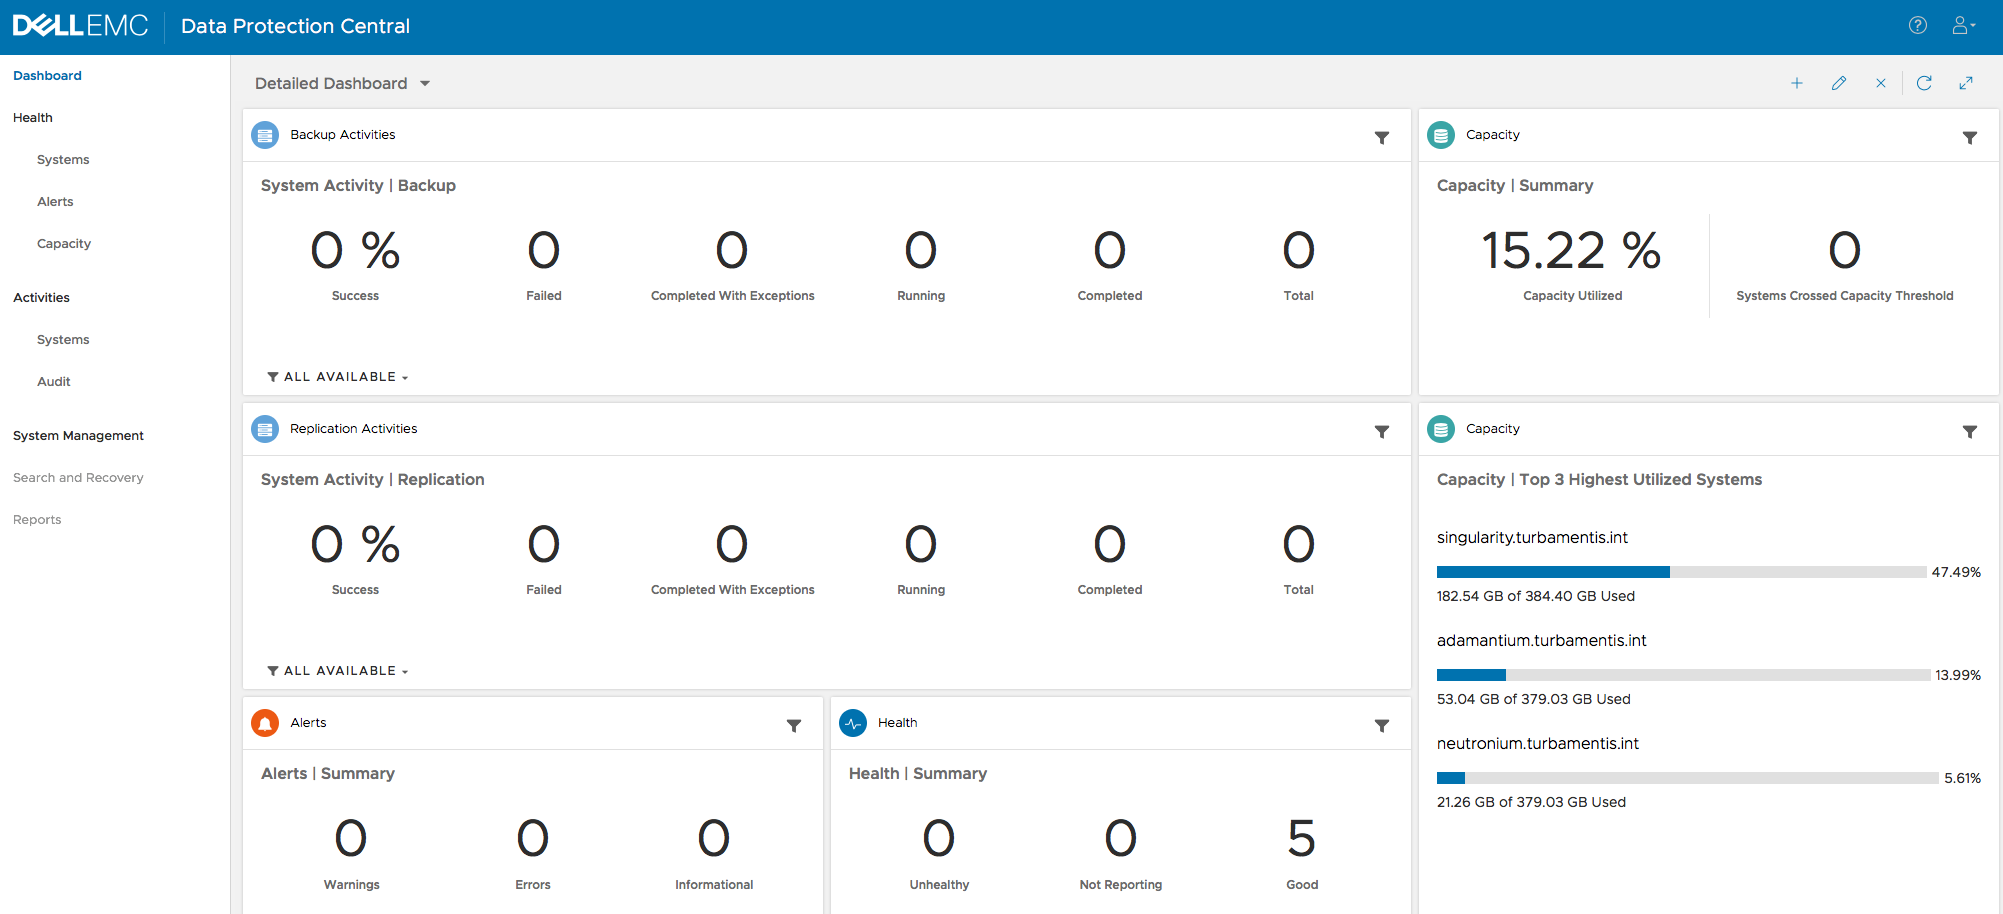
I wanted to correct those 0’s, so I fired off a backup in NetWorker, which resulted in DPC updating pretty damn quickly to show something was happening:
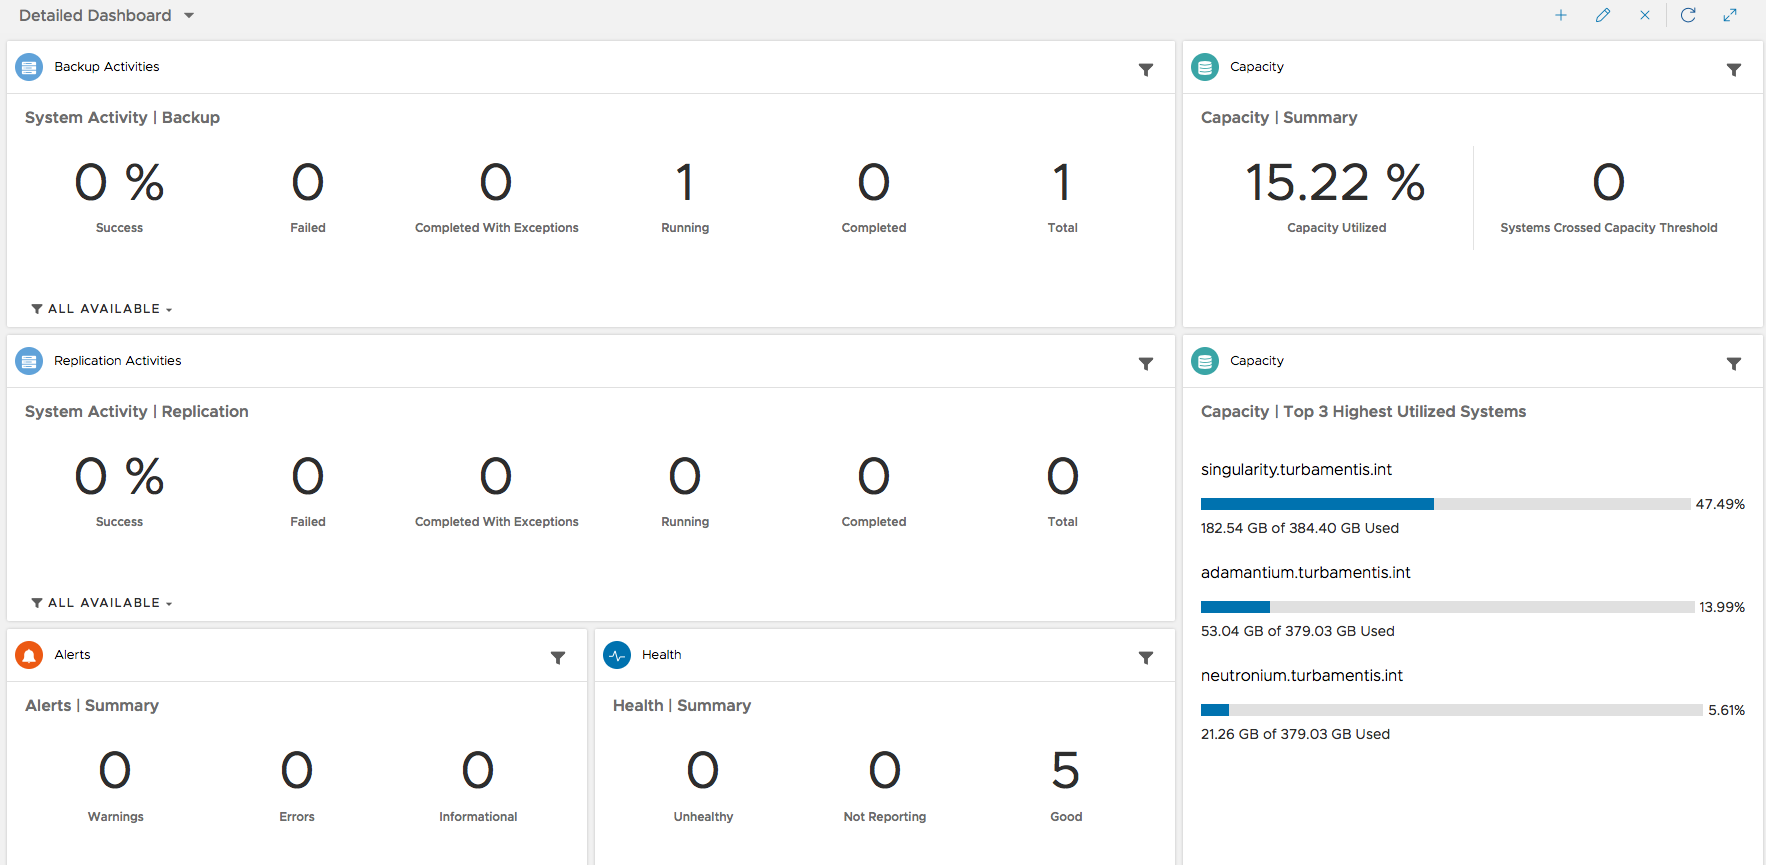
Likewise, when the backup completed and cloning started, the dashboard was updated quite promptly:
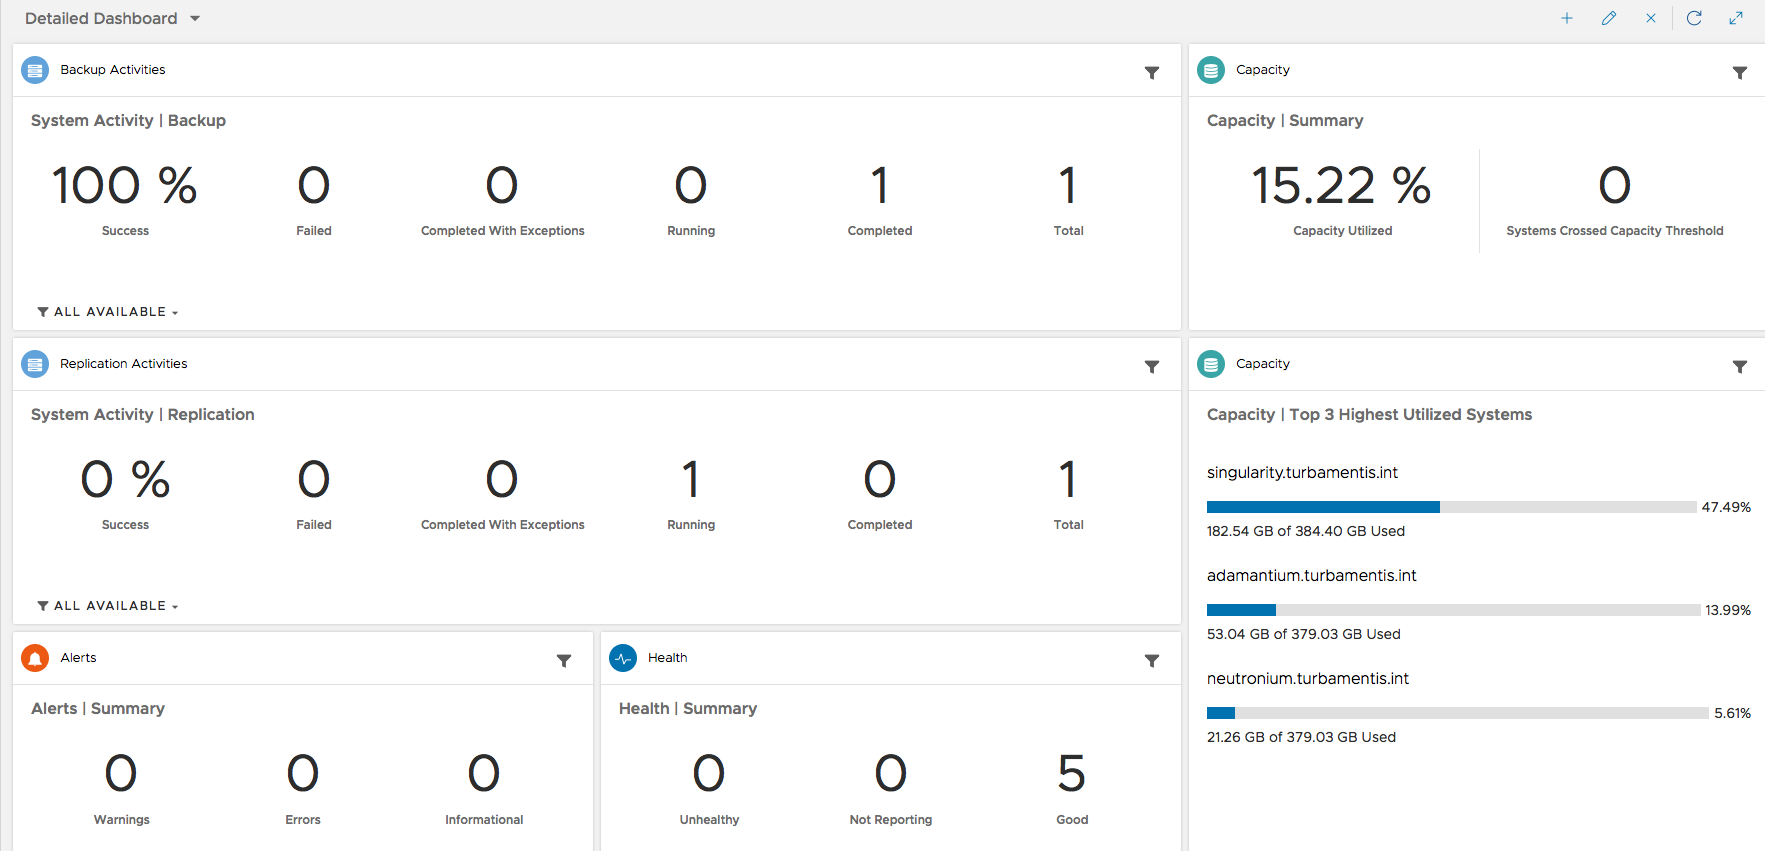
You can also see details of what’s been going on via the Activities > System view:

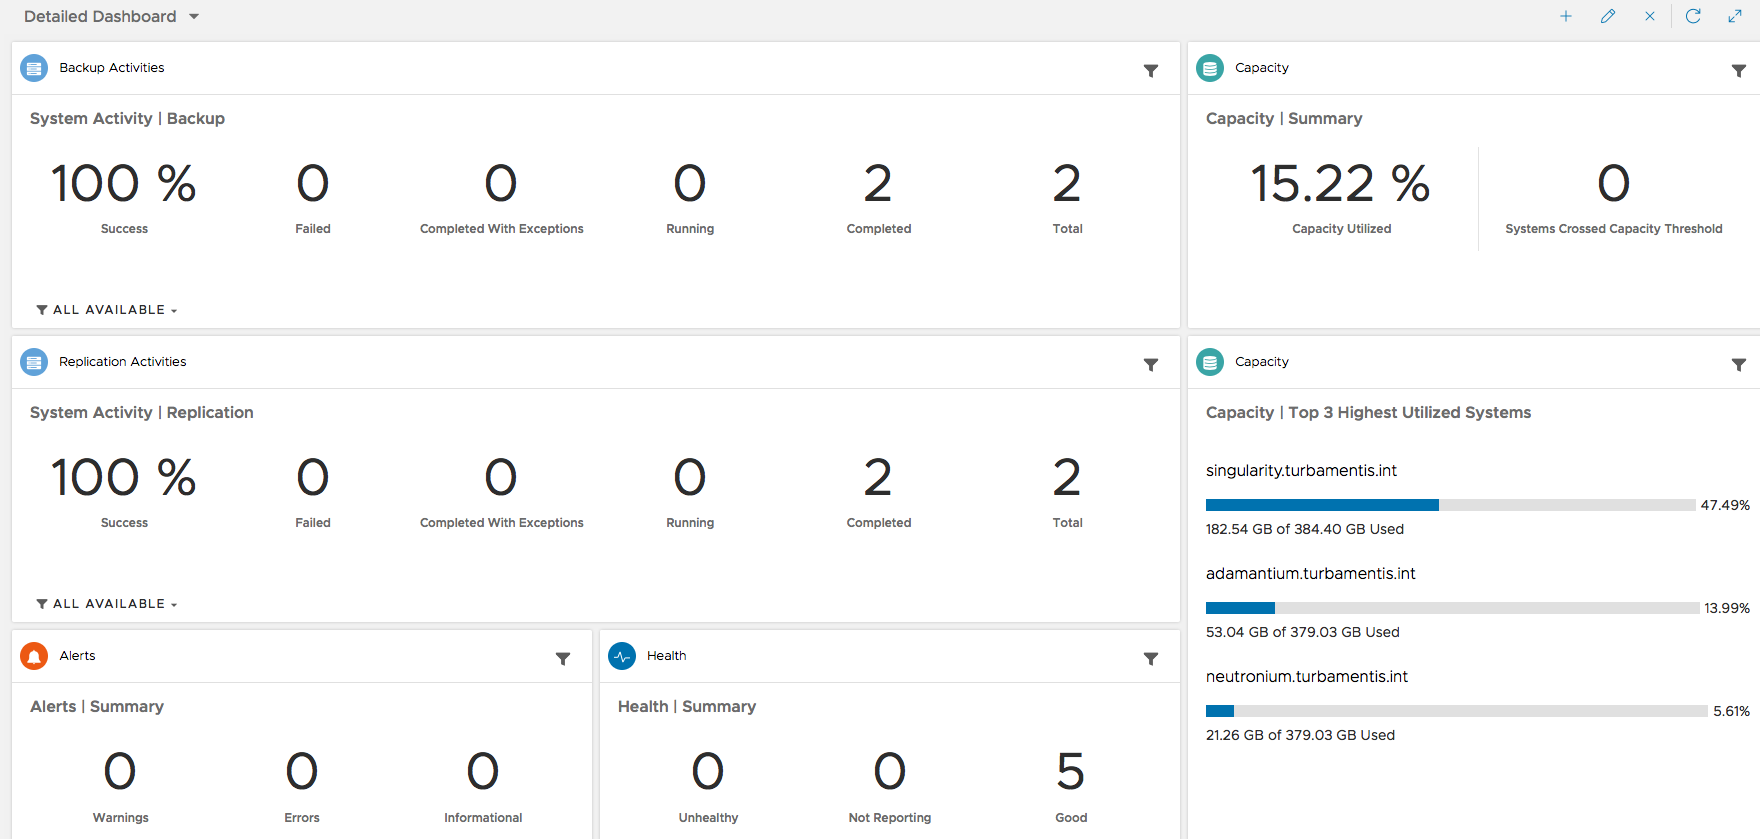
Then, with a couple of backup and clone jobs run, the Detailed Dashboard was updated a little more:
Now, I mentioned before that DPC takes on some Multi Systems Manager functionality for Avamar, viz.:
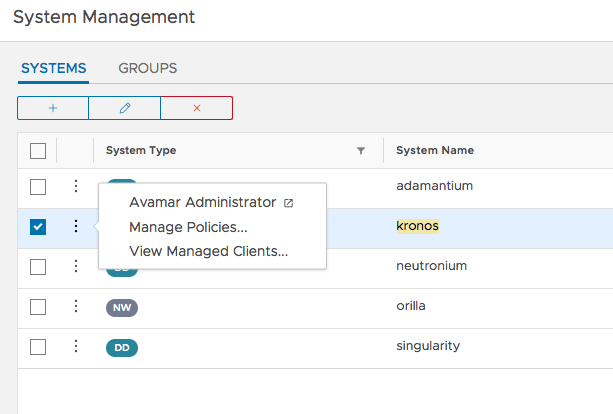
So that’s back in the Systems Management view. Clicking the horizontal ‘…’ item next to a system lets you launch the individual system management interface, or in the case of Avamar, also manage policy configuration.

In that policy view, you can create new policies, initiate jobs, and edit existing configuration details – all without having to go into the traditional Avamar interface:
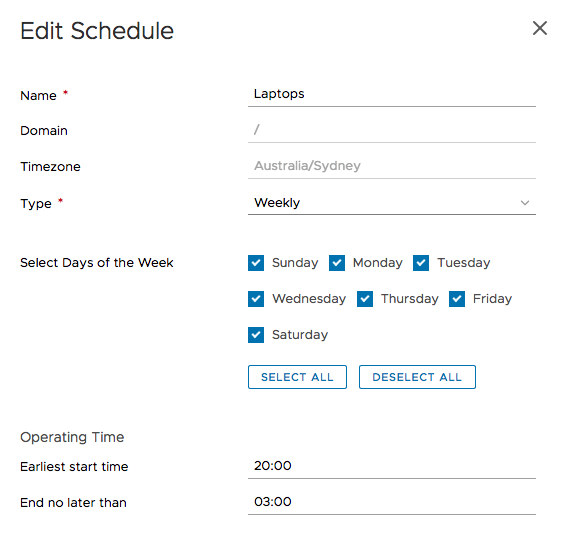
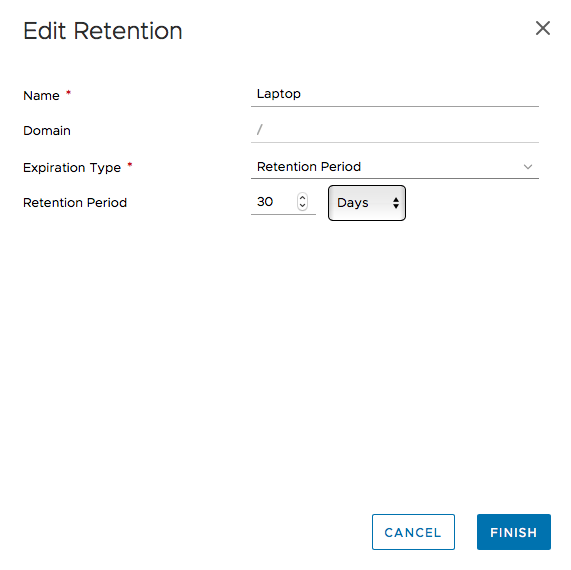
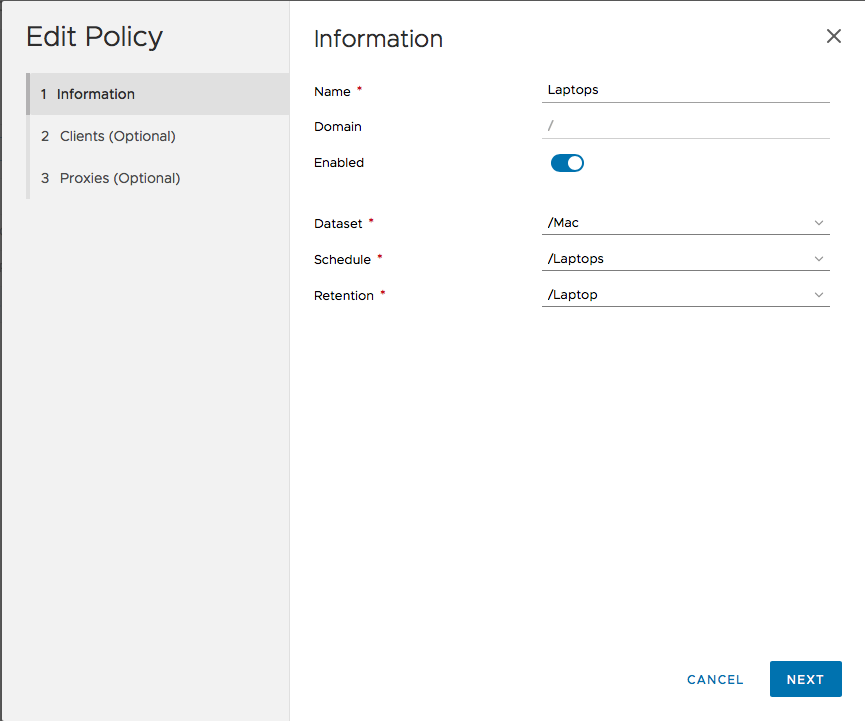
That’s pretty much all I’ve got to say about DPC at this point in time – other than to highlight the groups function in System Management. By defining groups of resources (and however you want to), you can then filter dashboard views not only for individual systems, but for groups, too, allowing quick and easy review of very specific hosts:

In my configuration there I’ve lumped by whether systems are associated with an Avamar backup environment or a NetWorker backup environment, but you can configure groups however you need. Maybe you have services broken up by state, or country, or maybe you have them distributed by customer or service you’re providing. Regardless of how you’d like to group them, you can filter through to them in DPC dashboards easily.
So there you go – that’s DPC v1.0.1. It’s honestly taken me more time to get this blog article written than it took me to deploy and configure DPC.
Note: Things I didn’t show in this article:
- Search and Recovery – That’s where you’d add a DP Search system (I don’t have DP-Search deployed in my lab)
- Reports – That’s where you’d add a DPA server, which I don’t have deployed in my lab either.
Search and Recovery lets you springboard into the awesome DP-Search web interface, and Reports will drill into DPA and extract the most popular reports people tend to access in DPA, all within DPC.
I’m excited about DPC and the potential it holds over time. And if you’ve got an environment with multiple backup servers and Data Domains, you’ll get value out of it very quickly.
Wow that looks handy. I’ll be deploying that OVA when I get some time.
Yes with growing backup environments, it seems to be really helpful for monitoring. And thanks for explaining.