If you’re new to Avamar, you might not know that the Avamar backup agent writes a lot of useful information to the client logs. In this post, I’m going to run through a few bits of information that I find particularly useful when looking through an Avamar backup agent log.
 On a default install on Linux, you’ll find the logs written into /usr/local/avamar/var/clientlogs. (It’ll be a similar scenario for an NDMP accelerator, as well. On Windows for a default install, check out C:\Program Files\avs\var\clientlogs). Looking in that directory, you’ll find a number of files – on the test01 server I setup in an earlier blog post, a directory listing looks like:
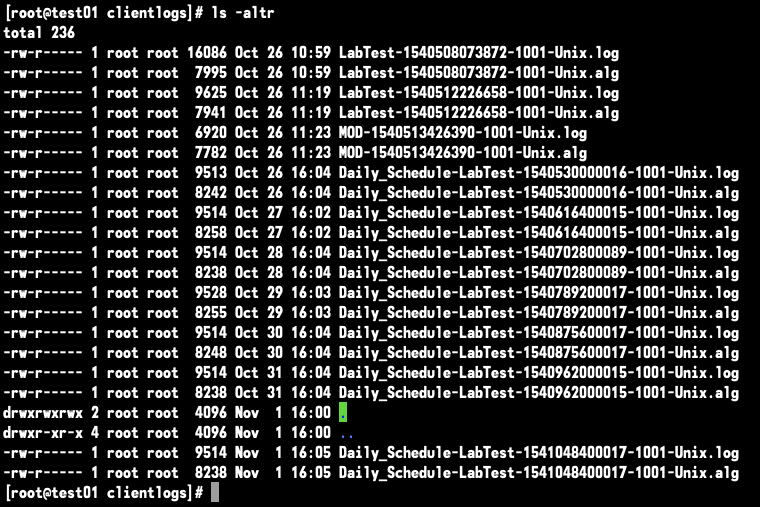
You’ll notice there’s pairs of logs generated during backups, .log and .alg. It’s the .log file I want to pull a few details out here today. Now you can pull a lot of logging information out of the Avamar GUI, but I’ve always liked to be able to drill down in via the command line as well, and there’s segments of data I find quite useful. Backup logs are written with naming details reflective of the retention period, policy and schedule they were generated for. You’ll see some backup logs in that listing starting with MOD – Manual-On-Demand.
The start of the log file for a backup will run through some of the initial connectivity information – the Avamar server, the command line arguments that avtar was called with, exclusion details, etc. You’ll then see information indicating a successful connection from the client to the Avamar server, such as:
2018-11-01 16:00:11 avtar Info <5550>: Successfully logged into Avamar Server [18.1.0-33] (Compression enabled)
2018-11-01 16:00:11 avtar Info <7563>: Back up of "/" on server "kronos.turbamentis.int" for /clients/test01.turbamentis.int
Looking through the log, it identified one gotcha in my lab setup – I’d forgotten to lock down the Avamar server to only backing up to Data Domain. That’s something that’s done by default when working through an Avamar implementation (and why I don’t do implementations!) Why I know that is when you’re backing up a Data Domain, you’ll see information logged about the Client<>DD connection, such as:
2018-11-01 19:04:50 avtar Info <40062>: GSAN connected via: IPv4, retrieved Data Domain IPv4 hostname = singularity.turbamentis.int
2018-11-01 19:04:50 avtar Info <10539>: Connecting to Data Domain Server "singularity.turbamentis.int"(1) (LSU: avamar-1516143927) with auth token
2018-11-01 19:04:50 avtar Info <10540>: - Resolved Data Domain Server name "singularity.turbamentis.int" to the IP address "192.168.100.249"
2018-11-01 19:04:50 avtar Info <41236>: - Connecting to Data Domain Server name "singularity.turbamentis.int" with token:094e4343d013a88d69bb6ed25230d3e9375d4674
(That logging, clearly, comes from a new backup I’d executed after correcting my error.)
After that, the Avamar log reports the file and hash cache files being opened:
2018-11-01 16:00:11 avtar Info <5586>: Loading cache files from /usr/local/avamar/var
2018-11-01 16:00:11 avtar Info <8650>: Opening filename cache file '/usr/local/avamar/var/f_cache.dat'
2018-11-01 16:00:11 avtar Info <5573>: - Loaded filename cache file (92,275,232 bytes), the value maybe the same as previous backups.
2018-11-01 16:00:11 avtar Info <8650>: Opening hash cache file '/usr/local/avamar/var/p_cache.dat'
2018-11-01 16:00:11 avtar Info <5573>: - Loaded hash cache file (100,663,840 bytes), the value maybethe same as previous backups.
2018-11-01 16:00:12 avtar Info <6426>: Done loading cache files
When the backup completes you’ll see a wrap-up message:
2018-11-01 16:05:41 avtar Info <5163>: Backup complete, wrapping-up session with Server
Just a little above the wrap up message, you’ll see a line that tells you the percentage change encountered between this backup and the last:
2018-11-01 16:05:41 avtar Info <5156>: Backup #9 timestamp 2018-11-01 16:05:31, 964,577 files, 29,940 directories, 24.17 GB (28 files, 157.4 KB, 0.00% new)
In this case, because the test system was pretty much inactive between backups, there was only a tiny about of new content – enough for Avamar to round it to effectively 0.00%, which makes sense when only 157.4KB had changed on a 24.17GB backup. Here’s an example of output where more new files were discovered, after I generated some new random content on the system:
2018-11-01 19:32:51 avtar Info <5156>: Backup #11 timestamp 2018-11-01 19:32:40, 1,038,297 files, 32,514 directories, 25.25 GB (67,776 files, 995.9 MB, 3.85% new)
(In that case, there was almost 1GB of new data, representing about a 3.85% change from the previous backup.)
Now, after the wrap-up message I’d previously mentioned, you’ll see information logged giving you the other key statistics of the backup – such as:
2018-11-01 16:05:41 avtar Info <6083>: Backed-up 24.17 GB in 5.52 minutes: 263 GB/hour (10,487,183 files/hour)
Overall, those are pretty good statistics of course, telling you deduplication is well and truly happening: 24.17 GB backed up in under 6 minutes, a speed of 263 GB per hour, with a file processing equivalent of almost 10.5 million files per hour.
As you can see, there’s a lot of information you can pull out of an Avamar client log, and it’s always worth while keeping those files in mind as part of operational or fault analysis.