
If you’re doing image-based backups of virtual machines, it’s useful to see the actual change rate of those virtual machines. After all, in typical scenarios, NetWorker only needs to look at and backup the data that’s changed from one backup to the next.
For example, if you have a thousand virtual machines averaging 200 GB each, your daily changed data could be:
- 1% average daily change rate: 2 TB
- 2% average daily change rate: 4 TB
- 5% average daily change rate: 10 TB
Of course, change rates vary from virtual machine to virtual machine, particularly based on what sort of workload is running inside. A VM hosting a database will typically see a much higher daily change rate than a VM hosting an application or filesystem. There are ways of interrogating virtual machine change rates through various VMware tools, but two challenges can occur here:
- What if, as the NetWorker administrator, you don’t have access to run those tools, and
- What if the tool reports data written rather than change rate?
There’s a big difference of course between the amount of data written to a virtual machine in a 24 hour period and the change rate for it as far as a backup is concerned. A system could theoretically have hundreds of gigabytes written to it daily, but if those writes all occur on a 10 MB chunk of a single virtual disk (e.g., constantly overwriting some logging file), the changed data from a backup perspective is just 10 MB.
If you need to work out the change rates for virtual machines, you’ll be pleased to know the policy logs for virtual machine backups contain this information. They can be found on the NetWorker server under the appropriate policy logs directory — on a Linux NetWorker server, for instance, that’s /nsr/policy/policyName/workflowName. In my lab, I have an ‘Infrastructure’ policy, and underneath that a ‘Virtual’ workflow, so on my NetWorker Server, it looks like this:
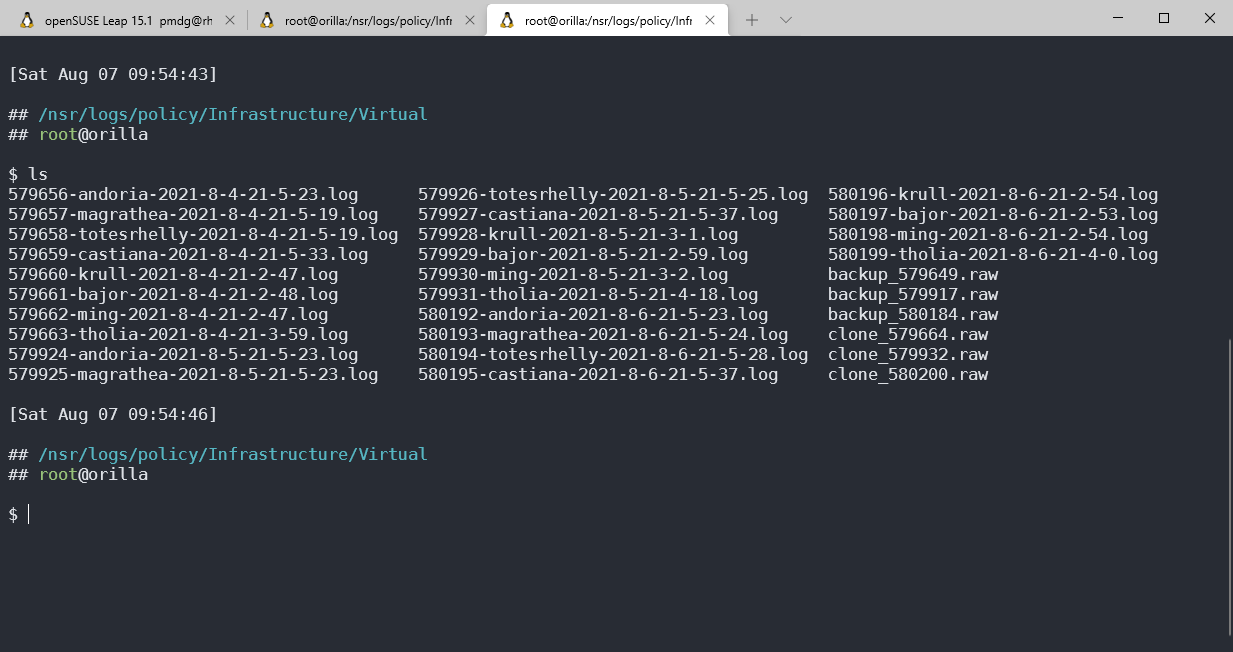
In the screen-grab above, the backup_number.raw and clone_number.raw represent the overall action logs, but each virtual machine backup is logged individually in a file using a filename of number–vmName–datetime.log. If you’re a backup administrator, there is a wealth of information in those log files!
Now, every line in the log file starts with a date/time stamp and build number for the vProxy. I’m going to strip that from the output I show below to make things easier to read, but an example of what that might look like is:
2021-08-04T11:00:16Z NOTICE: [@(#) Build number: 73]
So, what sort of details can you get from the log?
Backup Target Details
Target storage, the username used to connect to the storage, and even the path to the actual saveset file written:
"TargetSpec": {
  "DeviceType": "DataDomain",
  "HostName": "neutronium.turbamentis.int",
  "UserName": "boost",
  "UserPassword": "********",
  "ThumbPrint": "",
  "BackupMode": "VSS",
  "BackupPath": "orilla/BoostBackup//orilla/BoostBackup/5
3/78/d69d2ea2-00000006-780a733e-610a733e-02899ed8-a41317f3",
  "EncryptOnWire": false,
  "PreviousBackupPath": "/orilla/BoostBackup/25/08/6f7bc0
f3-00000006-ac0921be-610921be-02559ed8-a41317f3",
  "CurrentBackupPath": "/orilla/BoostBackup/active/d69d2e
a2-00000006-780a733e-610a733e-02899ed8-a41317f3",
Backup Transport Mode
You can quickly see what the requested and actual transport type was in the logs – just search for transport:
Did the Virtual Disk Even Get Touched?
Image-based backups should be as minimum-impact as possible. So if a virtual machine has disks that don’t change between backups, they don’t need to be touched:
'Hard disk 1': No changed blocks detected, skipping unnecessary access to Virtual Disk.
'Hard disk 2': No changed blocks detected, skipping unnecessary access to Virtual Disk.
Skipping disk mover for 'Hard disk 1', copying from previous backup.
Skipping disk mover for 'Hard disk 2', copying from previous backup.
Change Rate
And, as you’d have gathered from the title of this post, you can also get the change rate.
$ grep "change rate" 579656-andoria-2021-8-4-21-5-23.log
Used bytes = 5610930176, changed bytes = 163250176, change rate = 002.91%.
Used bytes = 523948523520, changed bytes = 132382720, change rate = 000.03%.
In the above example, there are two virtual disks for the machine, hence two lines. In the simplest analysis method, you can average the change rates for all disks reported, giving you the change rate for the virtual machine.
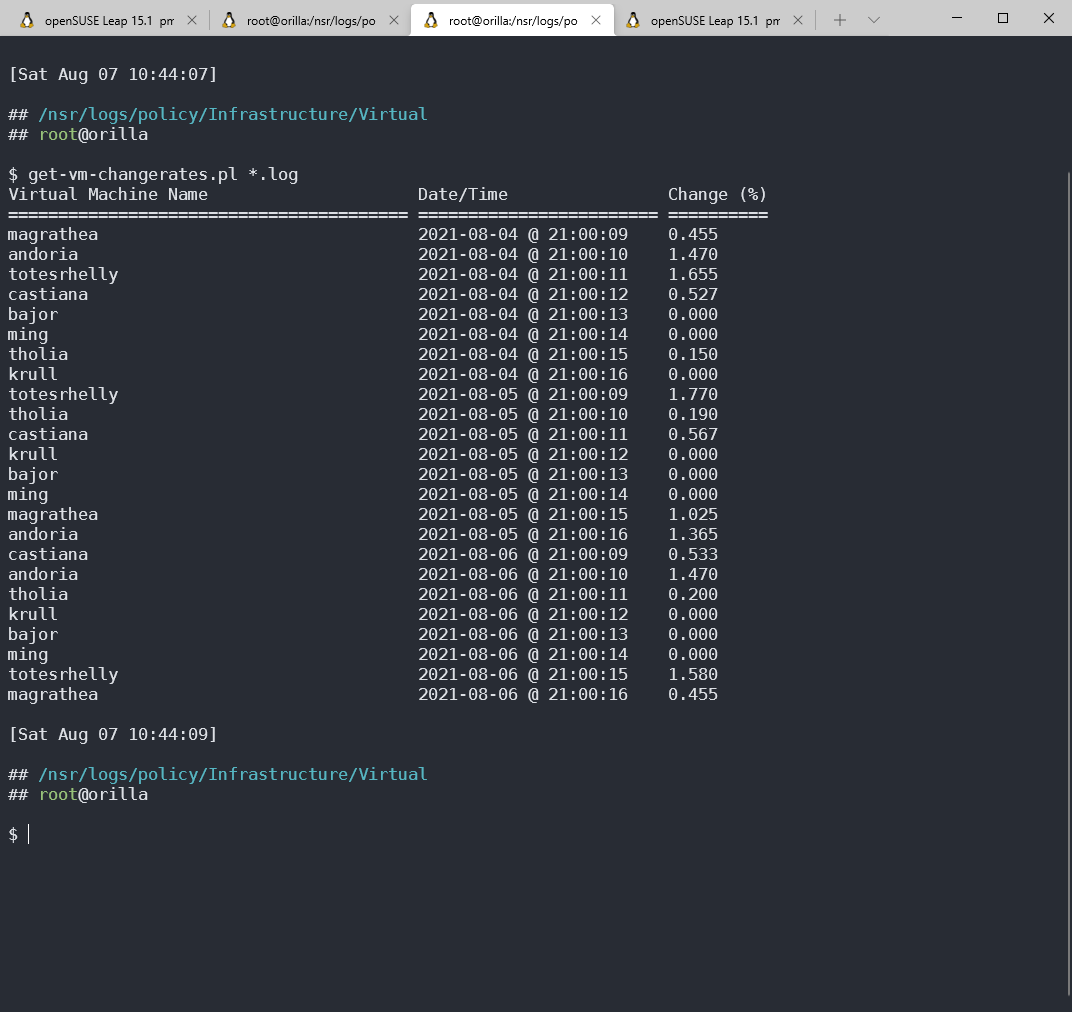
For instance, I wrote a simple Perl script called get-vm-changerates.pl that is passed a list of log files and calculates the average change rate for each virtual machine backup, printing it all out in a table. Running it against my logs, I got this output:
The script I wrote is below:
#!/usr/bin/perl -w

use strict;
my @files = @ARGV;

my %dataSet = ();
foreach my $file (@files) {
	if (open(LOGFILE,$file)) {
		my $vmName = "";
		my $changeRate = 0;
		my $backupTime = "";
		my $backupNtime = 0;
		my $crCount = 0;
		while (<LOGFILE>) {
			if ($_ =~ /VmSpec/) {
				my $nameLine = <LOGFILE>;
				chomp $nameLine;
				if ($nameLine =~ /^.*\"Name\":\s+\"(.*)\"\,/) {
					$vmName = $1;
				}
			}
			if ($_ =~ /^.*Used bytes = \d+, changed bytes = \d+, change rate = (.*)%/) {
				my $cr = $1;
				if ($changeRate == 0) {
					$changeRate = $cr;
				} else {
					$changeRate += $cr;
				}
				$crCount++;
			}
			if ($backupTime eq "" && $_ =~ /^.*\"BackupTime\":\s+\"(\d+)\"/) {
				$backupNtime = $1;
				my ($sec,$min,$hour,$mday,$mon,$year) = (localtime($backupNtime))[0,1,2,3,4,5];
				$mon++;
				$year+=1900;
				$backupTime = sprintf("%d-%02d-%02d @ %02d:%02d:%02d",$year,$mon,$mday,$hour,$min,$sec);
			}
		}
		close(LOGFILE);
		$dataSet{$backupNtime}{vm} = $vmName;
		$dataSet{$backupNtime}{datetime} = $backupTime;
		$dataSet{$backupNtime}{changerate} = $changeRate / $crCount;
	}
}

# Print it nicely.
printf("%-40s %-24s %-10s\n","Virtual Machine Name","Date/Time","Change (%)");
printf("%-40s %-24s %-10s\n","=" x 40,"=" x 24,"=" x 10);
foreach my $nsave (sort {$a <=> $b} keys %dataSet) {
	printf("%-40s %-24s %-.3f\n",$dataSet{$nsave}{vm},$dataSet{$nsave}{datetime},$dataSet{$nsave}{changerate});
}
It’s not a complex process at all — it’s just a case of quickly grabbing out the details we want from each log file, then pretty-printing it at the end.
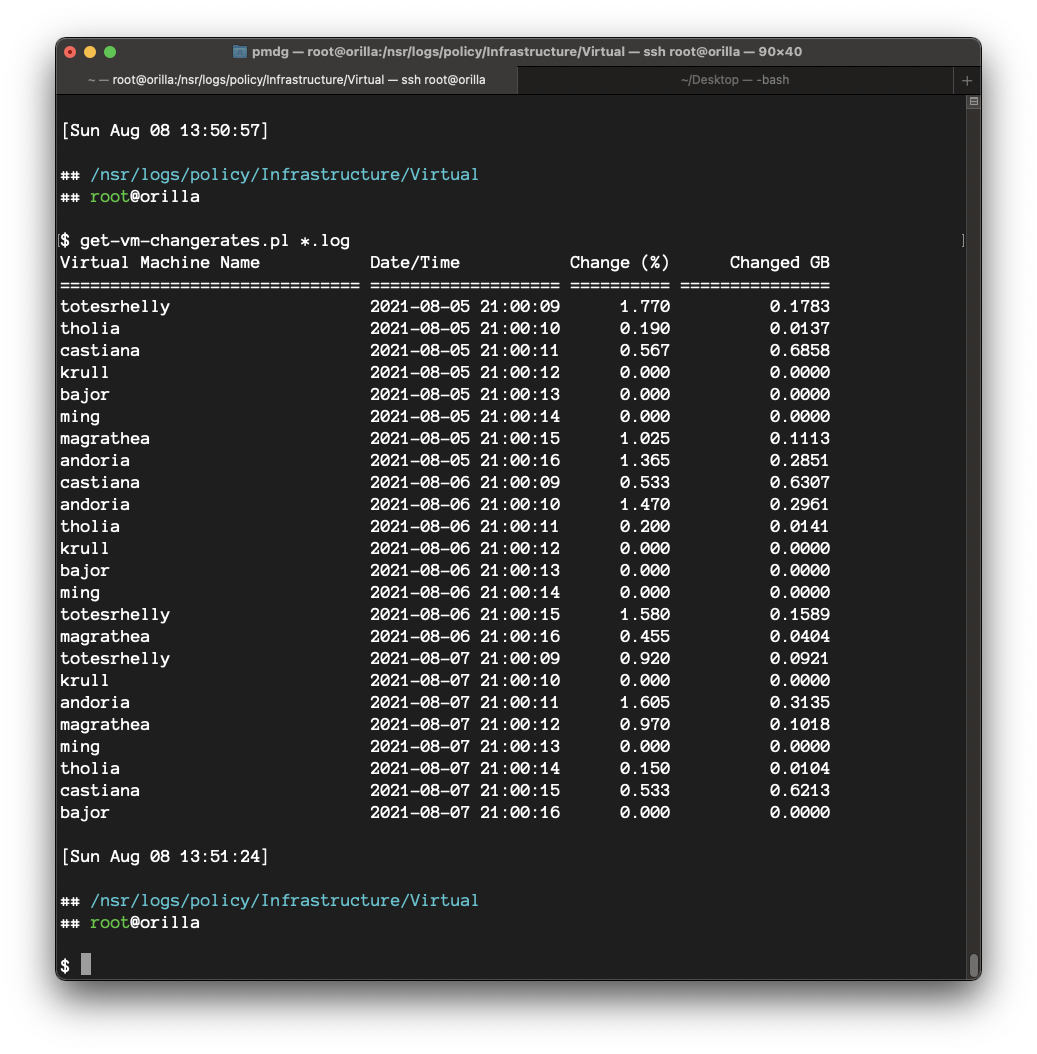
In fact, the day after I finished the script, it occurred to me that calculating the actual amount of changed data for each virtual machine and showing it would also be handy, so I updated the script to also extract that – here’s a sample output:
The ‘enhanced’ script is below:
#!/usr/bin/perl -w

use strict;
my @files = @ARGV;

my %dataSet = ();
foreach my $file (@files) {
	if (open(LOGFILE,$file)) {
		my $vmName = "";
		my $changeRate = 0;
		my $changedGB = 0;
		my $backupTime = "";
		my $backupNtime = 0;
		my $crCount = 0;
		while (<LOGFILE>) {
			if ($_ =~ /VmSpec/) {
				my $nameLine = <LOGFILE>;
				chomp $nameLine;
				if ($nameLine =~ /^.*\"Name\":\s+\"(.*)\"\,/) {
					$vmName = $1;
				}
			}
			if ($_ =~ /^.*Used bytes = \d+, changed bytes = (\d+), change rate = (.*)%/) {
				my $changedBytes = $1;
				my $cr = $2;

				$changedGB += ($changedBytes / 1000 / 1000 / 1000);

				if ($changeRate == 0) {
					$changeRate = $cr;
				} else {
					$changeRate += $cr;
				}
				$crCount++;
			}
			if ($backupTime eq "" && $_ =~ /^.*\"BackupTime\":\s+\"(\d+)\"/) {
				$backupNtime = $1;
				my ($sec,$min,$hour,$mday,$mon,$year) = (localtime($backupNtime))[0,1,2,3,4,5];
				$mon++;
				$year+=1900;
				$backupTime = sprintf("%d-%02d-%02d %02d:%02d:%02d",$year,$mon,$mday,$hour,$min,$sec);
			}
		}
		close(LOGFILE);
		if (length($vmName) >= 27) {
			$dataSet{$backupNtime}{vm} = substr($vmName,0,27) . "...";
		} else {
			$dataSet{$backupNtime}{vm} = $vmName;
		}
		$dataSet{$backupNtime}{datetime} = $backupTime;
		$dataSet{$backupNtime}{changerate} = $changeRate / $crCount;
		$dataSet{$backupNtime}{changedGB} = $changedGB;
	}
}

# Print it nicely.
printf("%-30s %-19s %-10s %15s\n","Virtual Machine Name","Date/Time","Change (%)","Changed GB");
printf("%-30s %-19s %-10s %-15s\n","=" x 30,"=" x 19,"=" x 10,"=" x 15);
foreach my $nsave (sort {$a <=> $b} keys %dataSet) {
	printf("%-30s %-19s %10.3f %15.4f\n",$dataSet{$nsave}{vm},$dataSet{$nsave}{datetime},$dataSet{$nsave}{changerate},$dataSet{$nsave}{changedGB});
}
So as you can see, it’s very simple to see the change rates for virtual machine backups — and trivial to script, too.
Really Helpful
Hello, I tried utilizing your script but unable to find the log files as you describe them. I looked in the path. I have Tier 1, Tier 2, Tier 3 policies with a subset of workflows underneath them. Is it possible that it is not logging? I did find some log files, i.e. backup_number.log but no data is returned. Is there something i need to turn on in Networker to generate these logs? Could they be stored somewhere else? I am running an older version of networker. V18.2.0.0. Could something have changed that prevents your perl script from working appropriately. When i tell it to use a specific log file, it errors because it cannot fine “changerate”, as it does not exist in any log files that I have found.
Hi, without seeing your log files I can’t say for sure why it isn’t working. Can I suggest instead checking out the script in this blog post? It will give you much more comprehensive data, and relies on mminfo instead.