In PowerProtect Data Manager 19.10, a report engine was added. Data Protection Advisor could, and can still be used to provide reporting against your entire data protection environment (including any PowerProtect Data Manager systems). However, this now lets you do reporting as part of the holistic Data Manager experience.
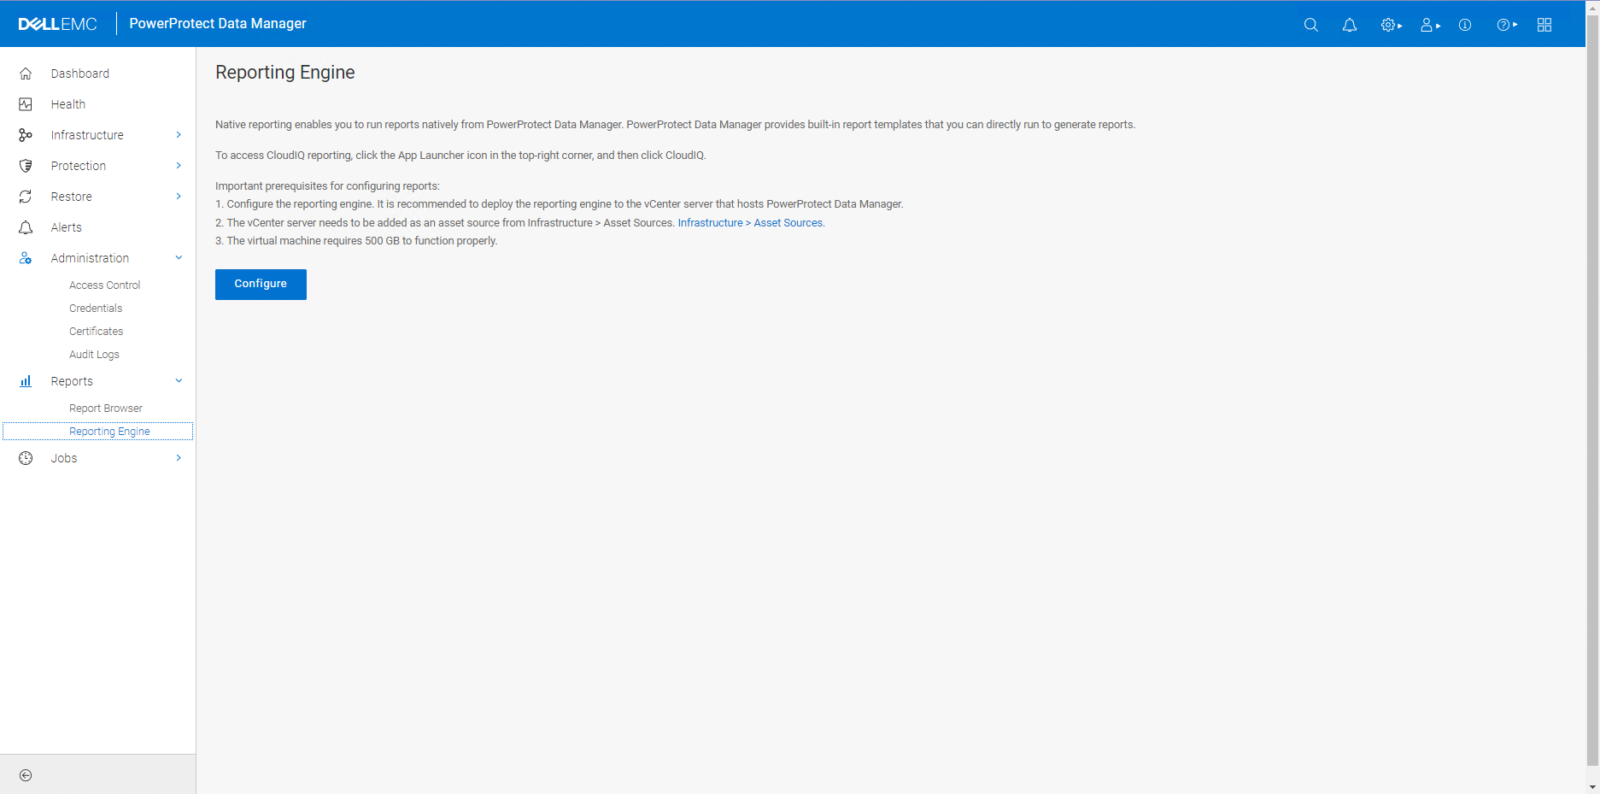
The first step to using the reporting engine is to deploy it. For this, you’ll need an IP address and configured hostname as part of your initial planning. Then, go to Reports > Reporting Engine in Data Manager:

If you have the IP address/hostname ready, you can start the deployment by clicking the Configure button.
Your next step will be to select the vCenter resources to deploy against, and enter the networking details, as shown below:
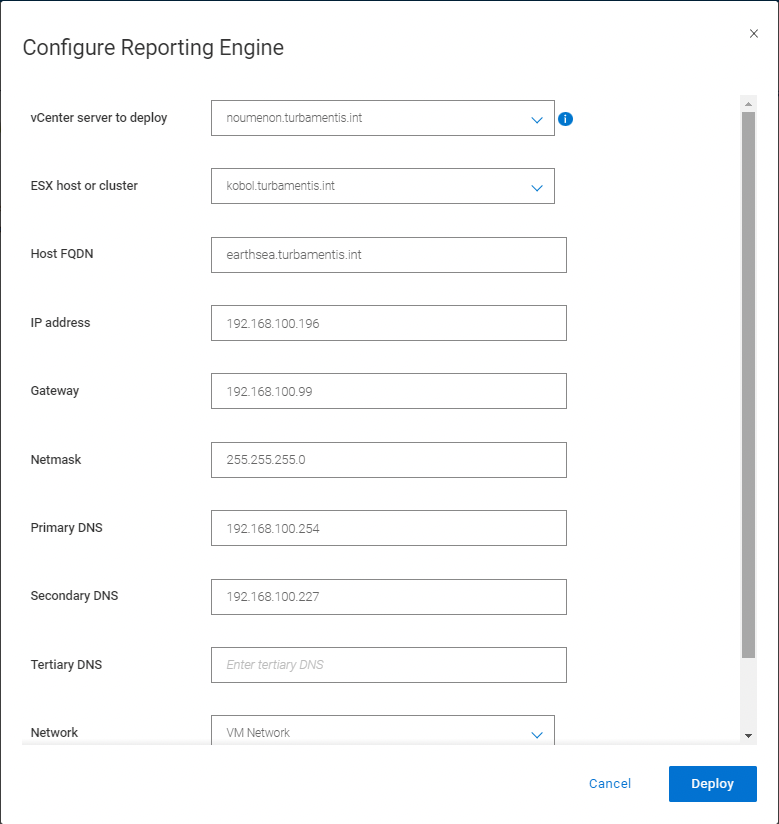
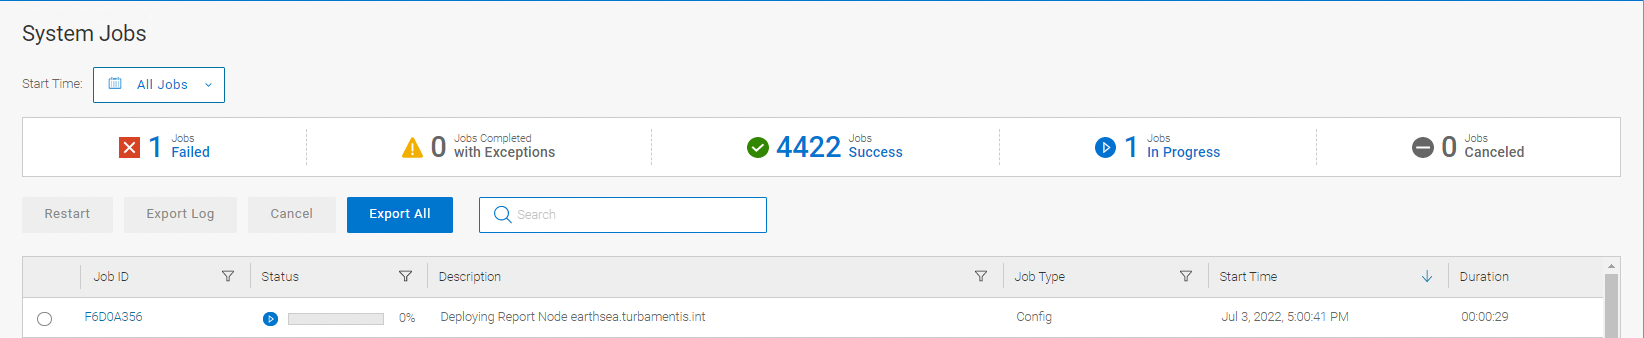
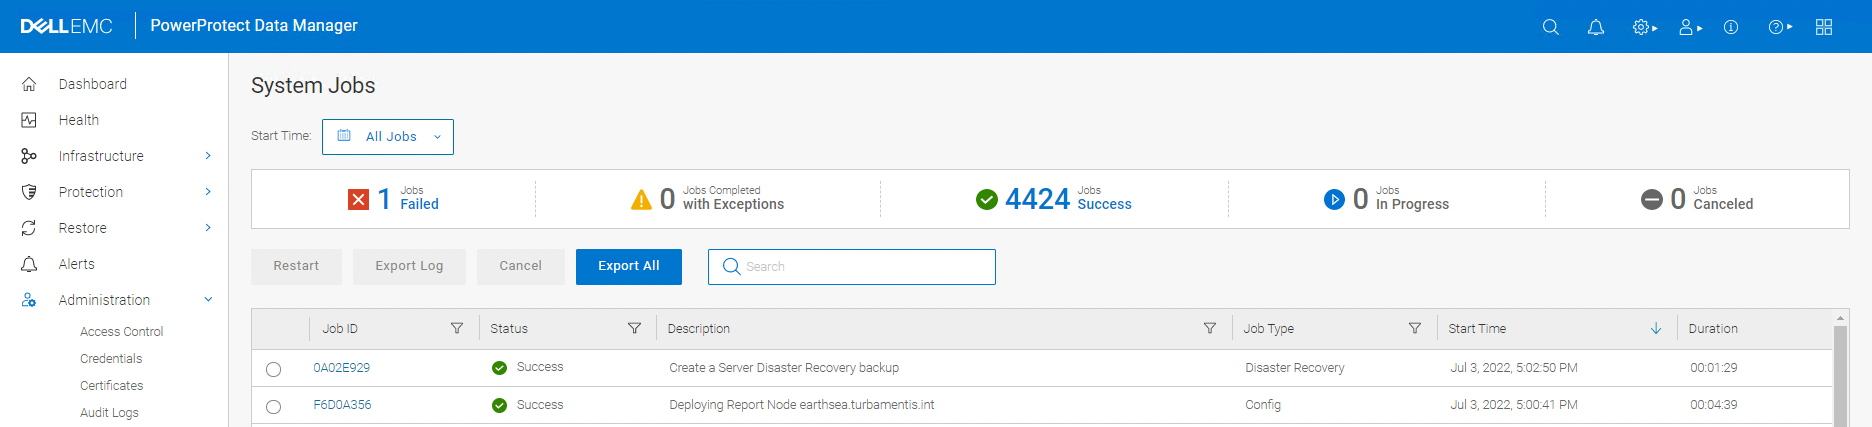
When you’ve entered these details, click the Deploy button to start the deployment. Data Manager will handle all the background tasks associated with this and you can track it in the System Jobs area:
Once the reporting engine is deployed, it will start tracking events for reporting. I.e., reporting history starts from the time of deployment. So, to show a basic report, I ran a VMware backup policy.
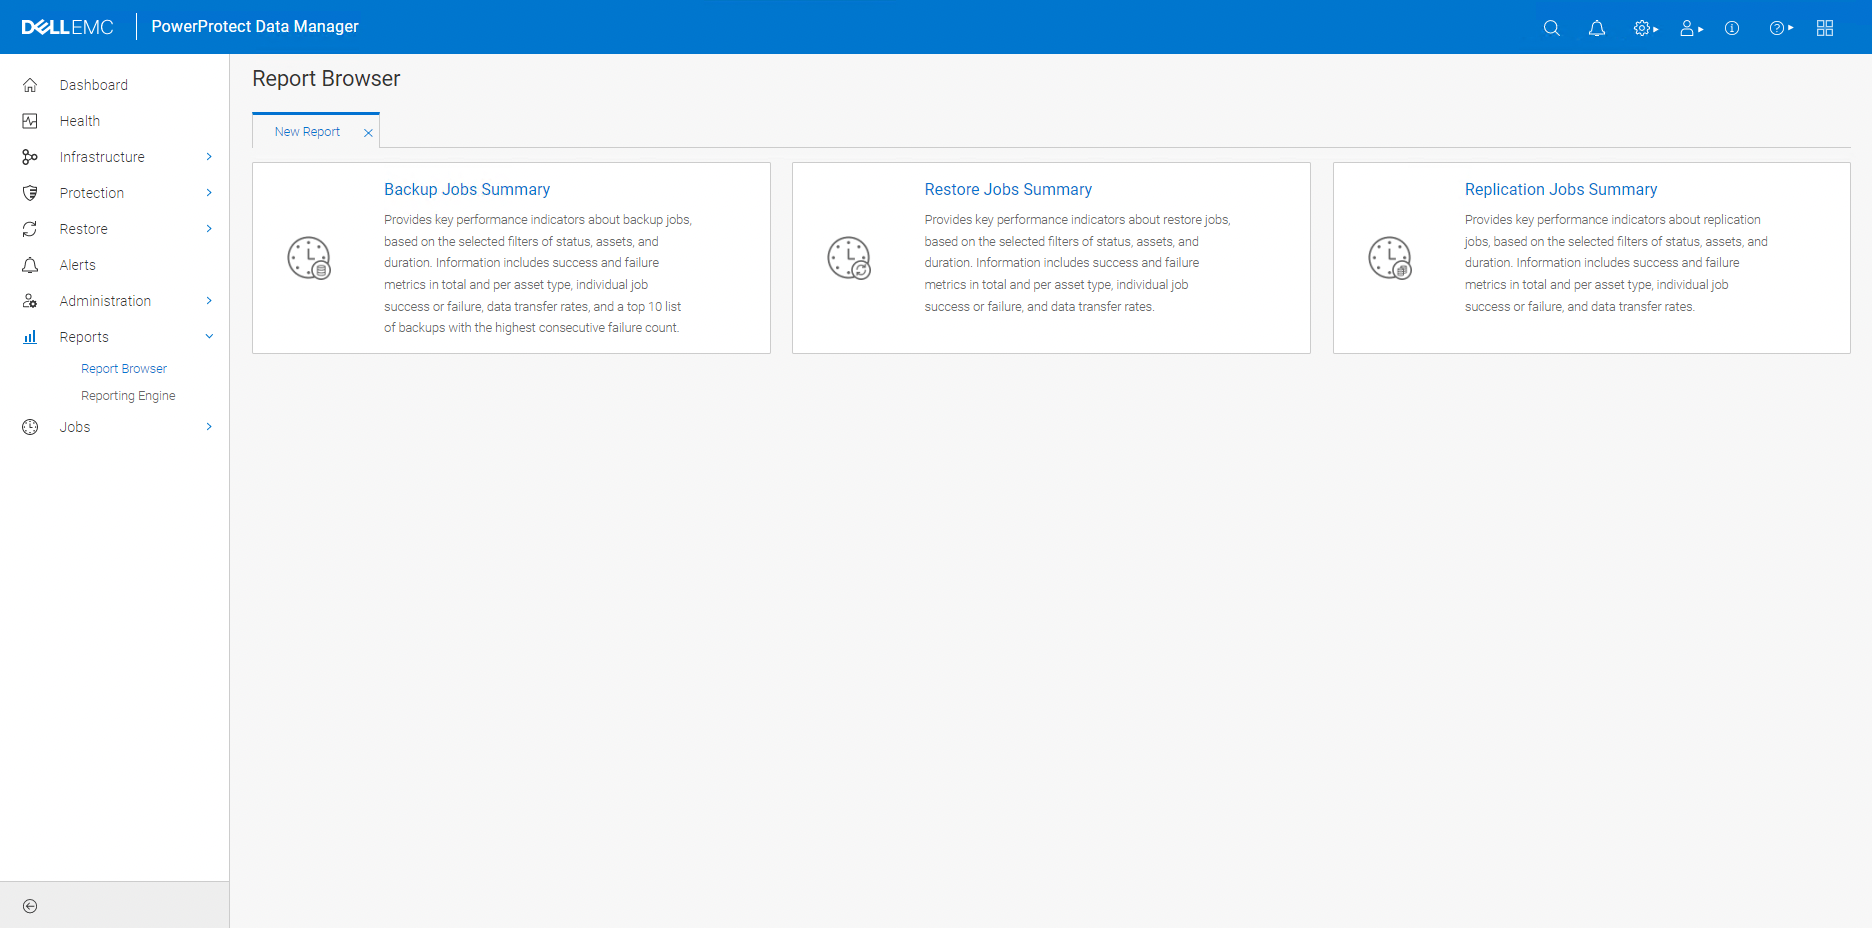
To run a report, go to Reports > Report Browser. For now, there are three types of reports to choose from:
- Backup jobs summary
- Restore jobs summary
- Replication jobs summary
The report browser is shown below:
Each of those reports actually contains a number of component details. When you click the Backup jobs report, for instance, you’ll start with a prompt for the timeframe and resources you want to have reported:
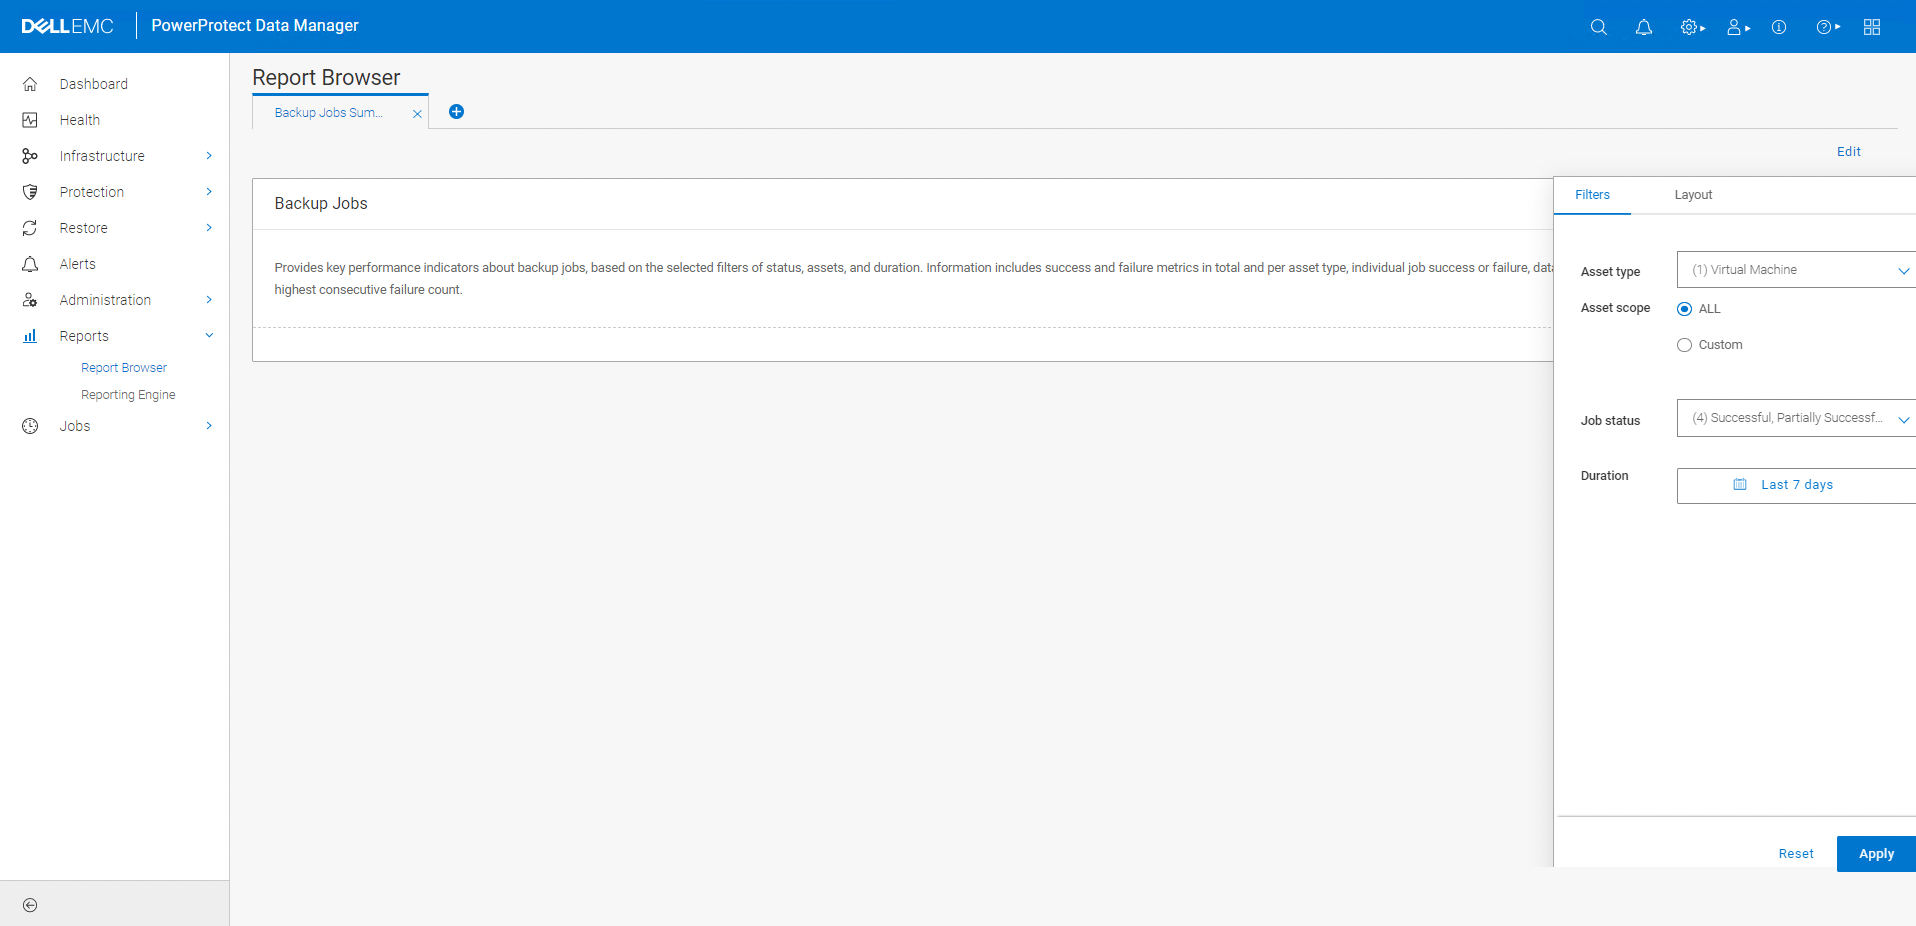
The above screen shows the filters selection. You’ll notice a layout pane as well, which you can use to decide what report elements will be shown:
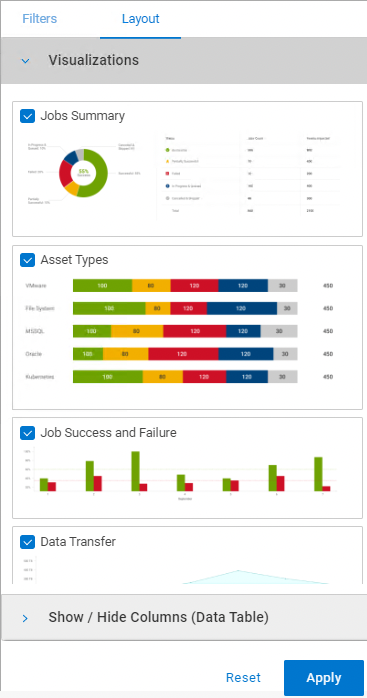
Once you’ve input the details, you can click Apply to run the report.
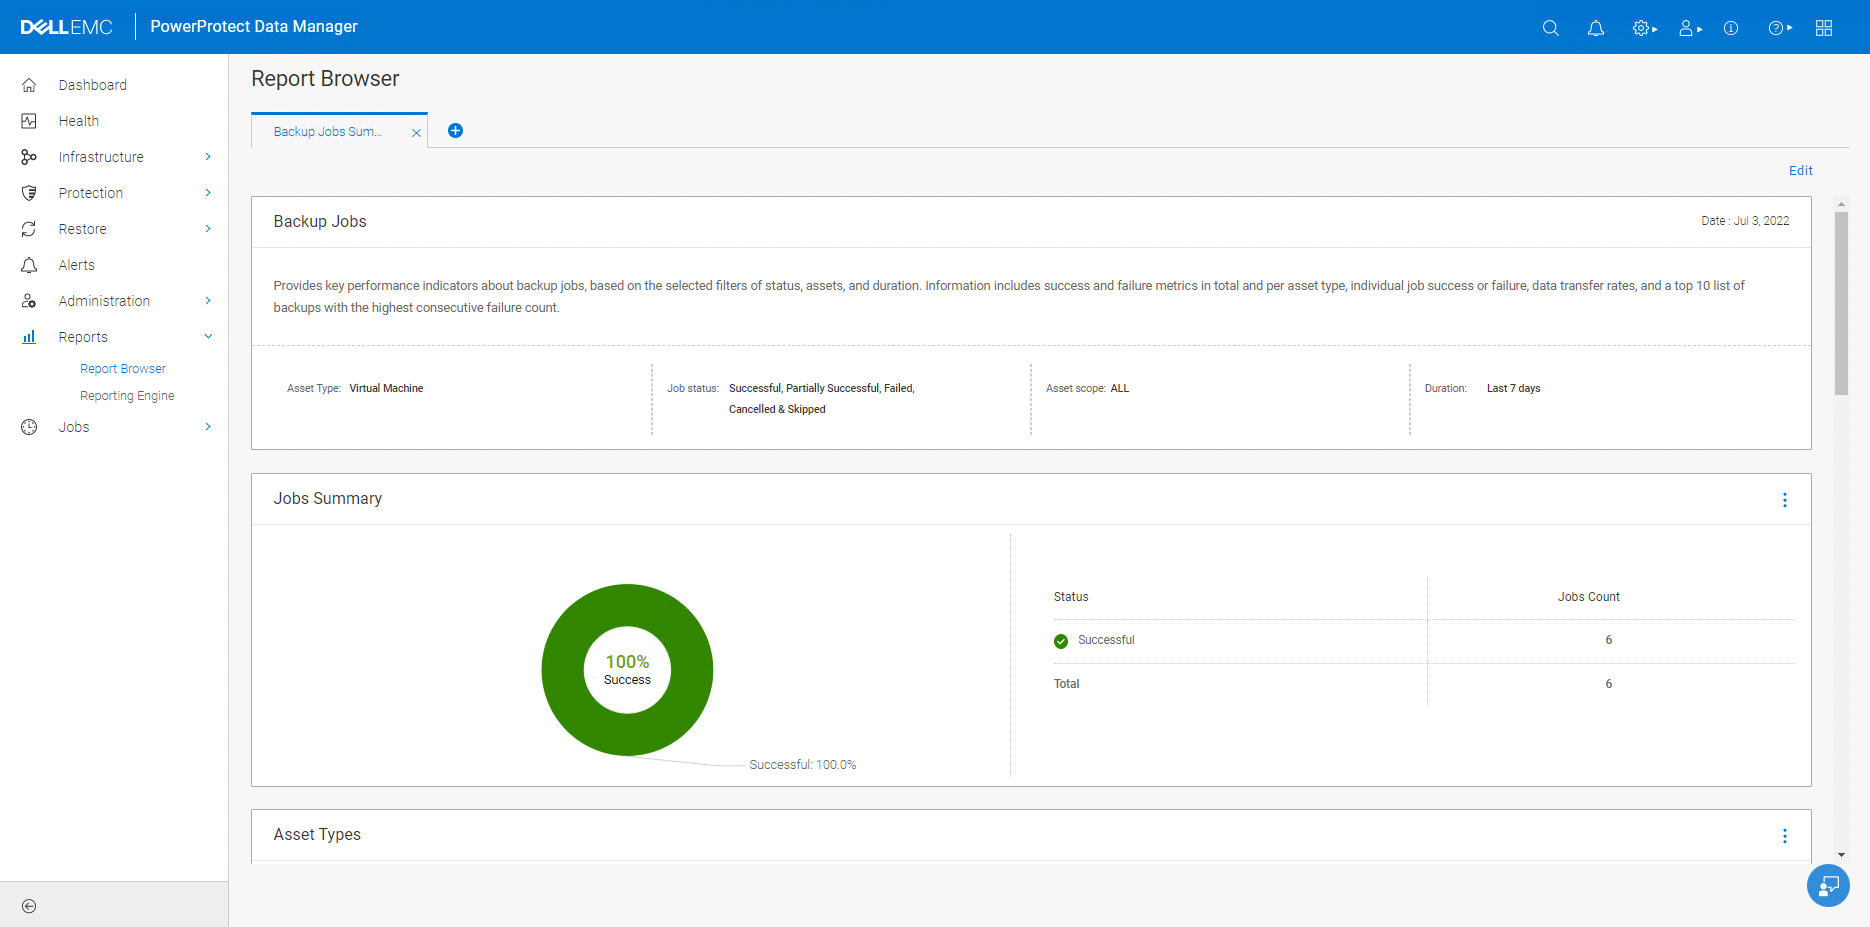
As you can see, you can get native reporting up and running in Data Manager now with very little effort.
Hello Preston.
Got a client that wants to know exactly how much data an asset source is using on the target DataDomain atached to a PPDM server, would this reporting engine help with that?
For this you’re best off using Data Protection Advisor and having it monitor the PPDM environment.
Hi Preston,
1) How many days of backup job status can PPDM save and show in the report?
2) Can we check the backup job status on last year?
I believe reporting data about assets is maintained for around 18 months as a default setting. Activities data is currently maintained indefinitely IIRC.