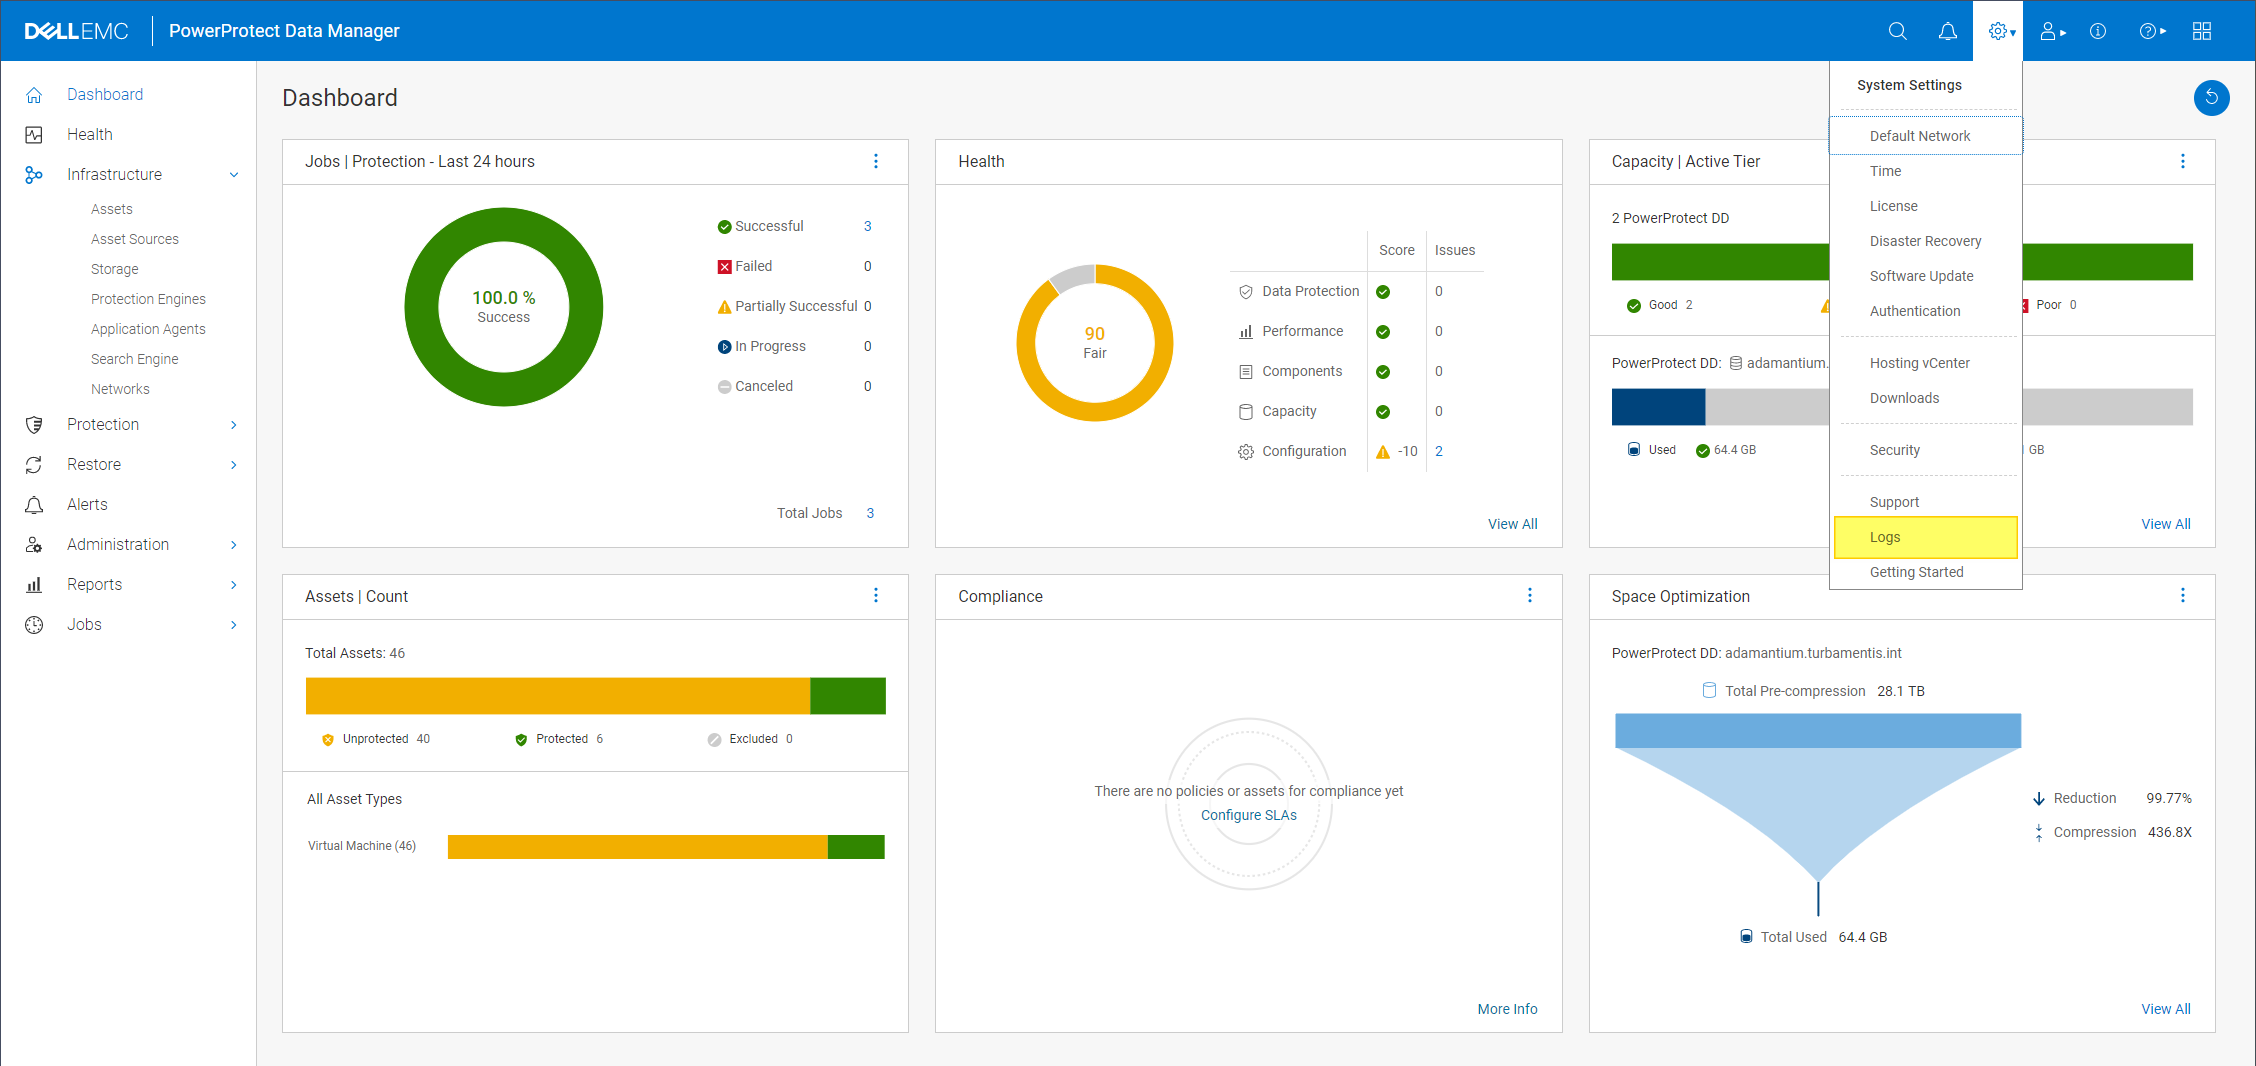
As I mentioned in an earlier post, PowerProtect Data Manager 19.11 introduces support for remote syslog servers, allowing you to collate all your Data Manager logging in your tool of choice.
To configure this feature, you can go to Settings > Logs:
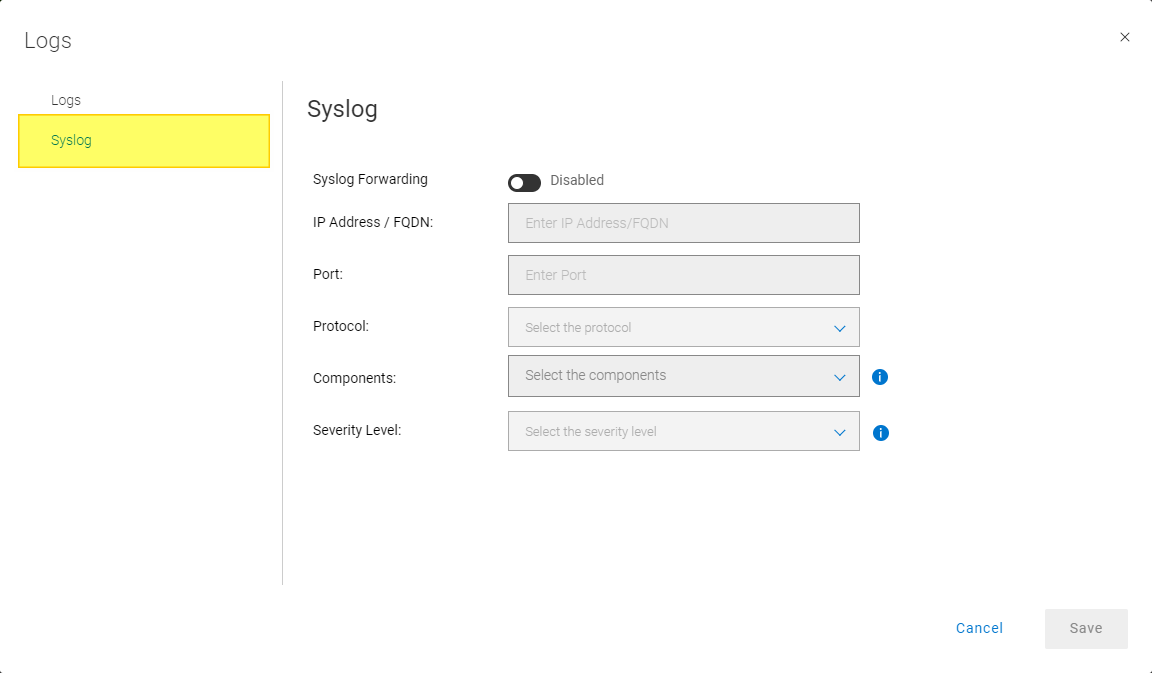
Under the Log settings area, go to the Syslog menu option and you’ll initially get a blank form for configuring your rsyslog functionality:
To configure a remote syslog server, click the “Syslog Forwarding” toggle and fill in the details. For me, this looked like the following:
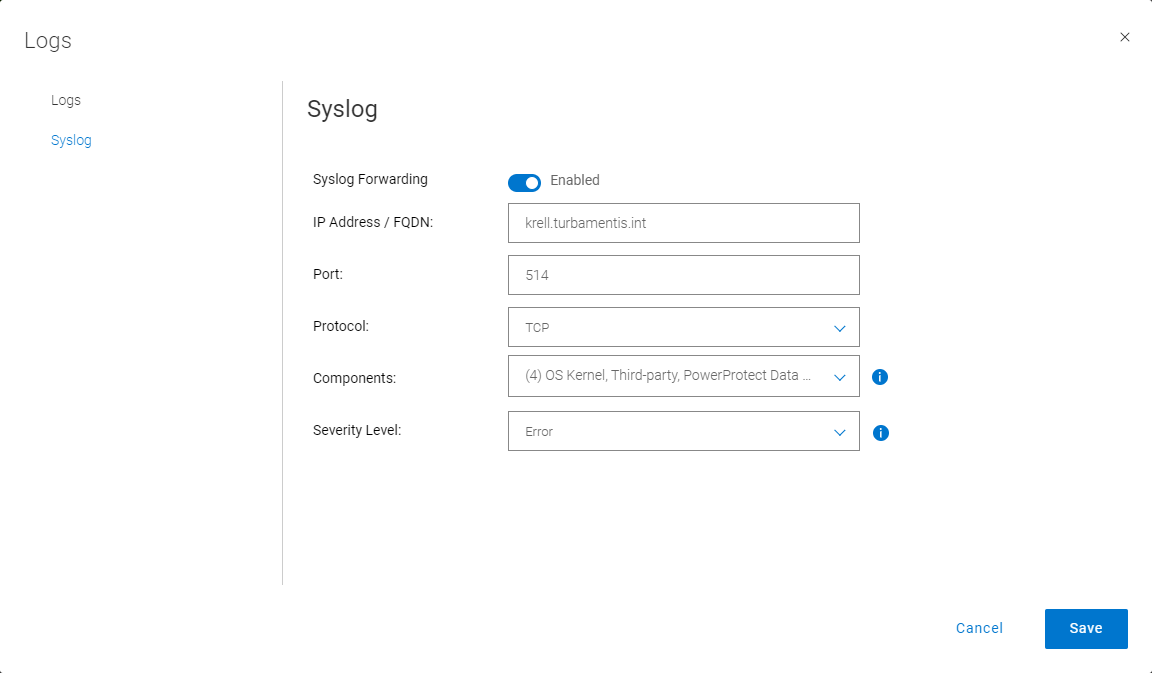
In addition to details for your rsyslog host, you’ll need to choose which components you wish to send details for, and the severity level you wish to see:
- Components. These can be:
- OS Kernel
- Third-party
- PowerProtect Data Manager alerts and audit
- PowerProtect Data Manager services
- Severity. This can be:
- Error
- Critical
- Alert
- Emergency
Once I had these details configured for my lab, I jumped across to my syslog aggregator and confirmed I was now getting logs from Data Manager:
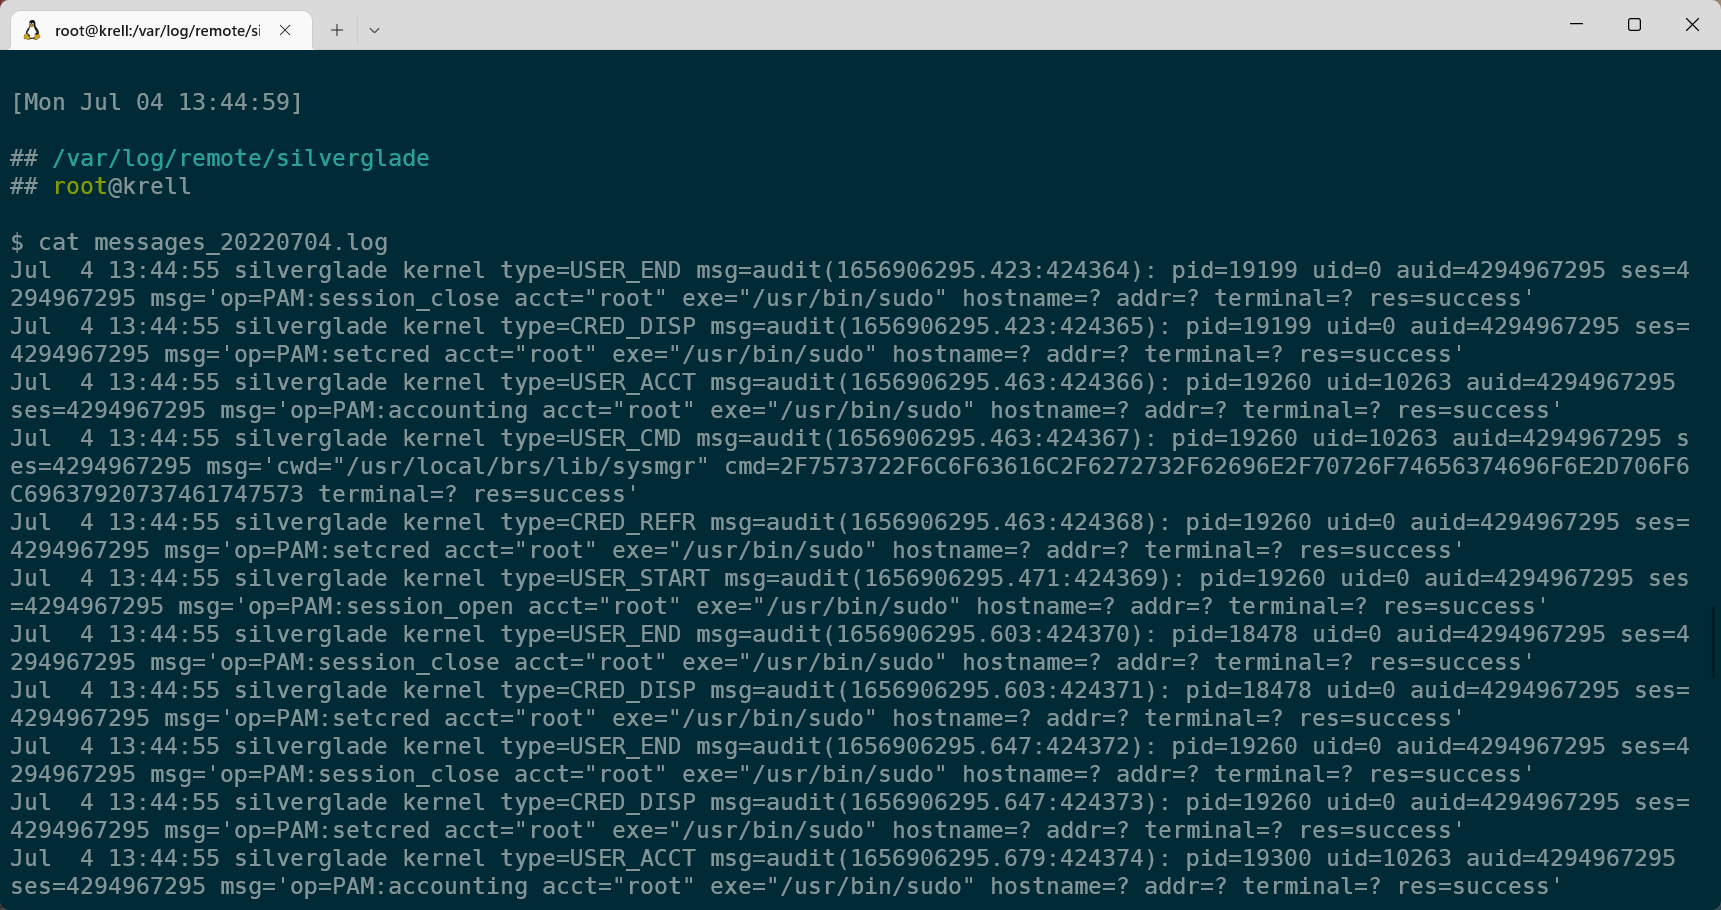
And there you have it: simple, easy, monitored.